

Answered step by step
Verified Expert Solution
Question
1 Approved Answer
The annual report for Fraser & Neave Holdings Bhd is as follows: The annual report for Dutch Lady Milk Industry Bhd is as follows: Fraser

The annual report for Fraser & Neave Holdings Bhd is as follows:

The annual report for Dutch Lady Milk Industry Bhd is as follows:
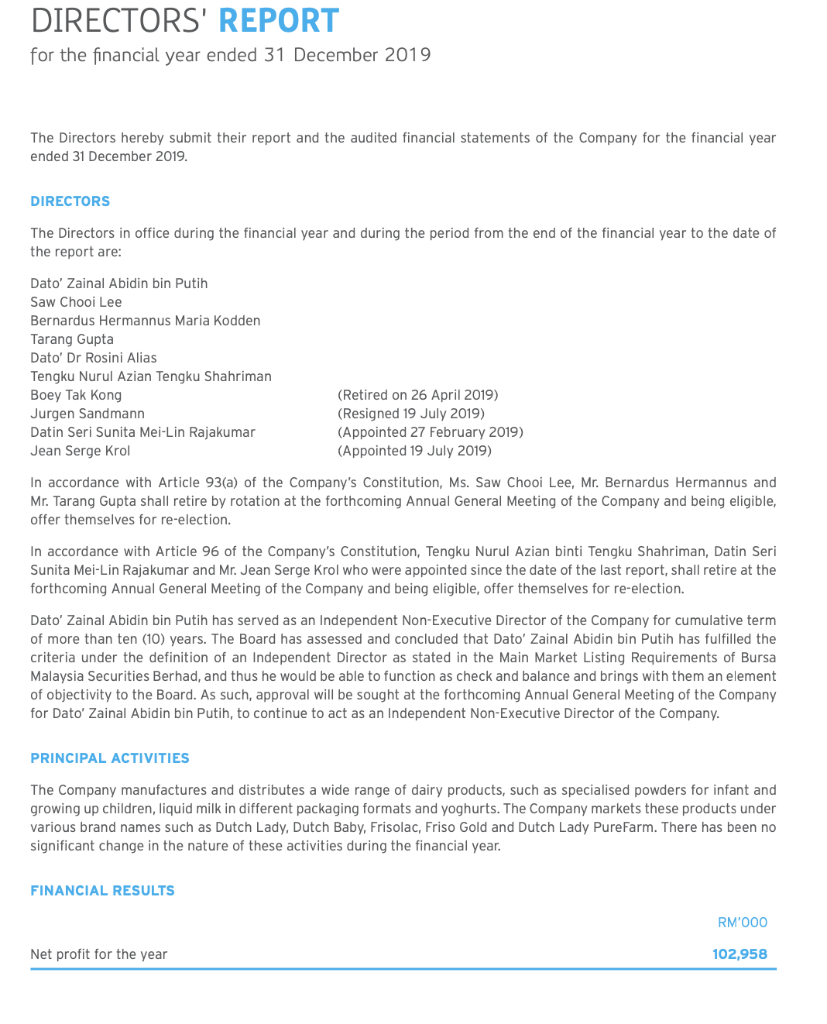
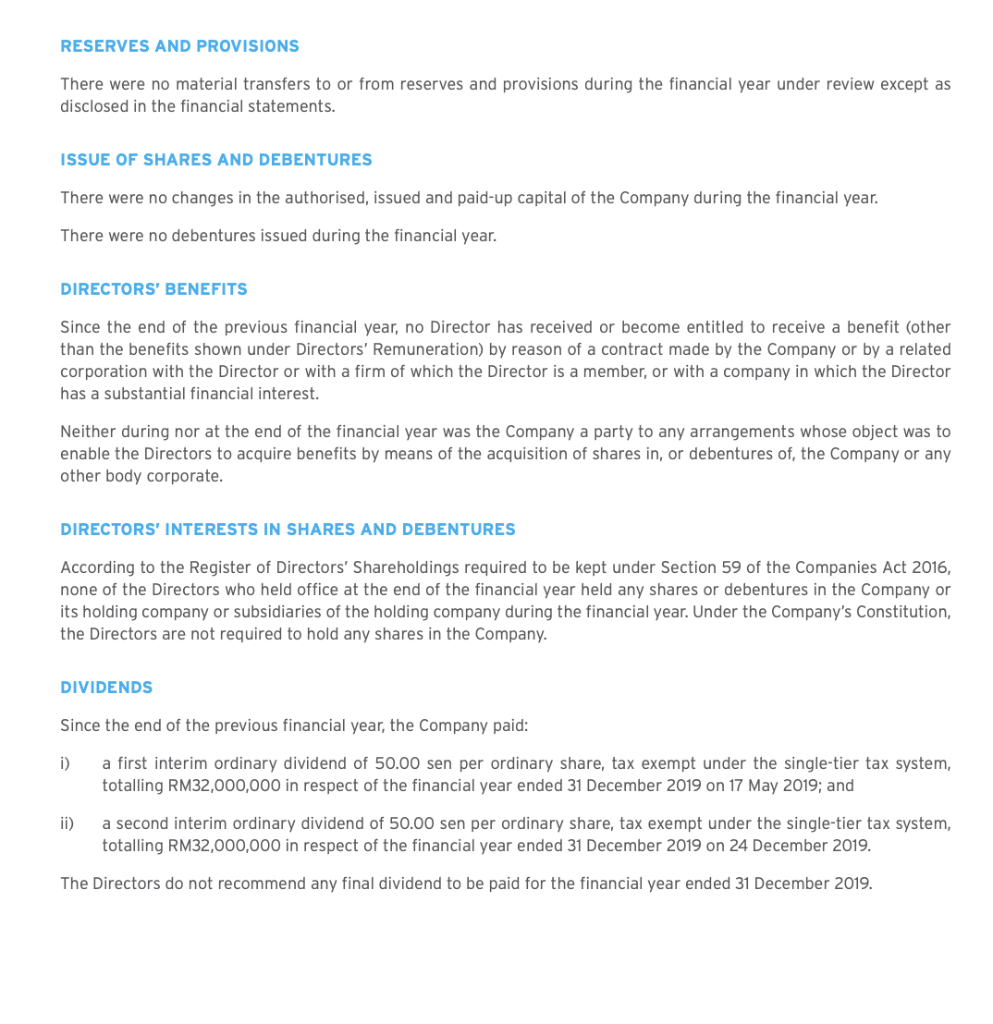
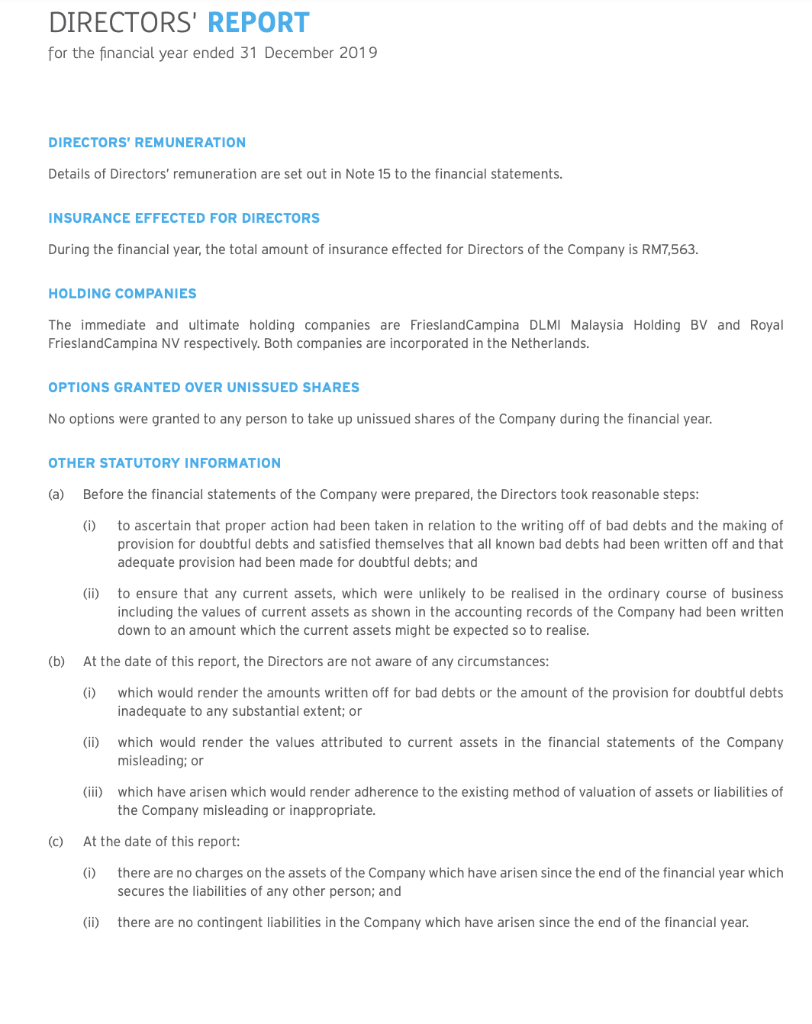
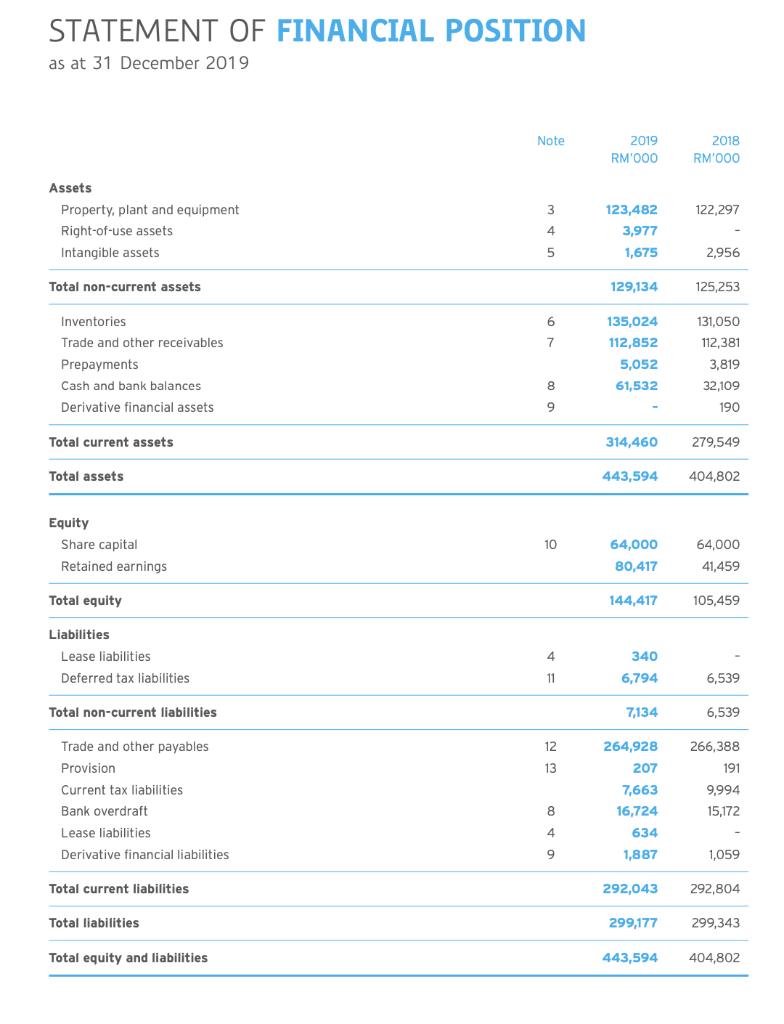
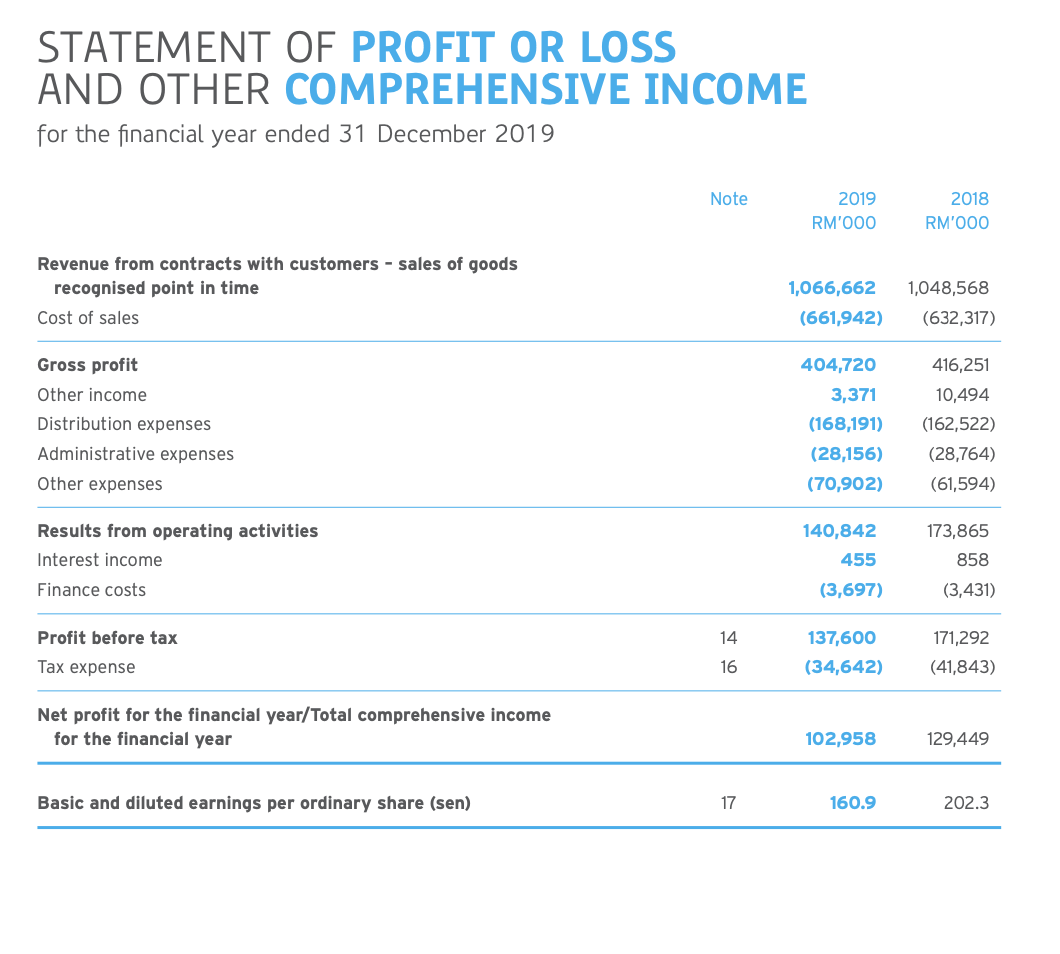
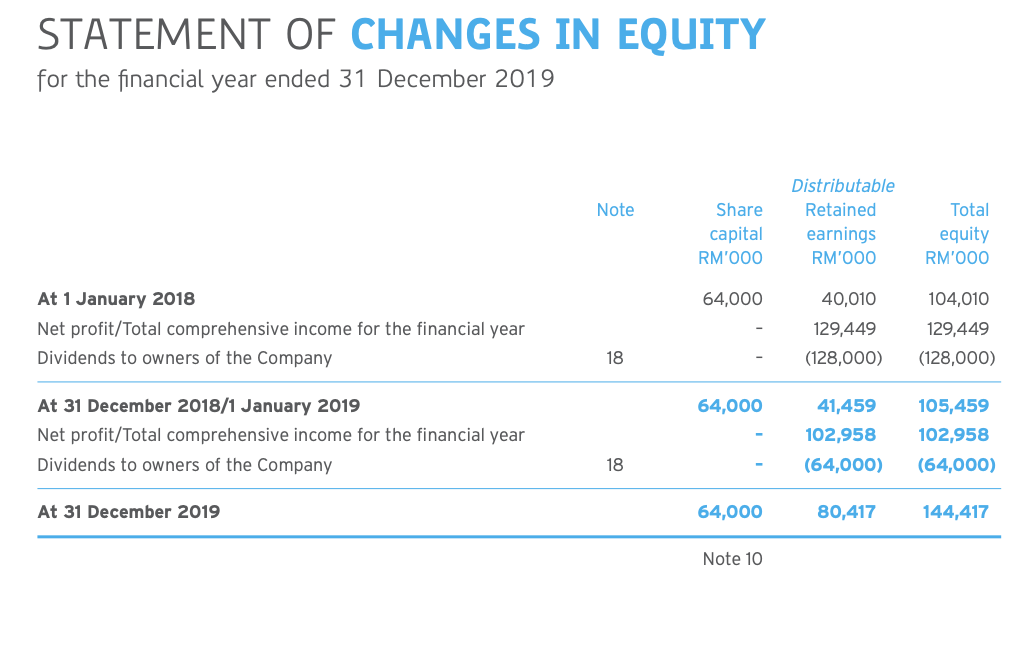
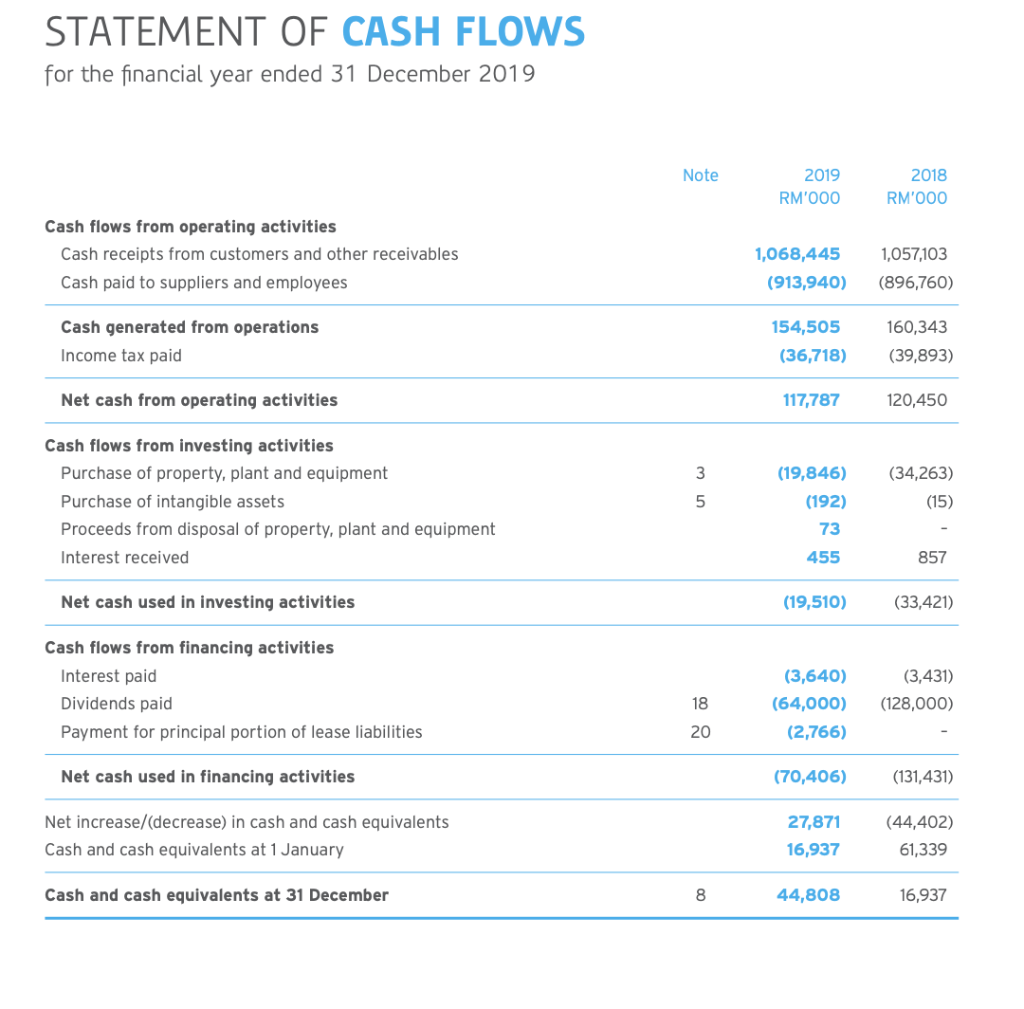
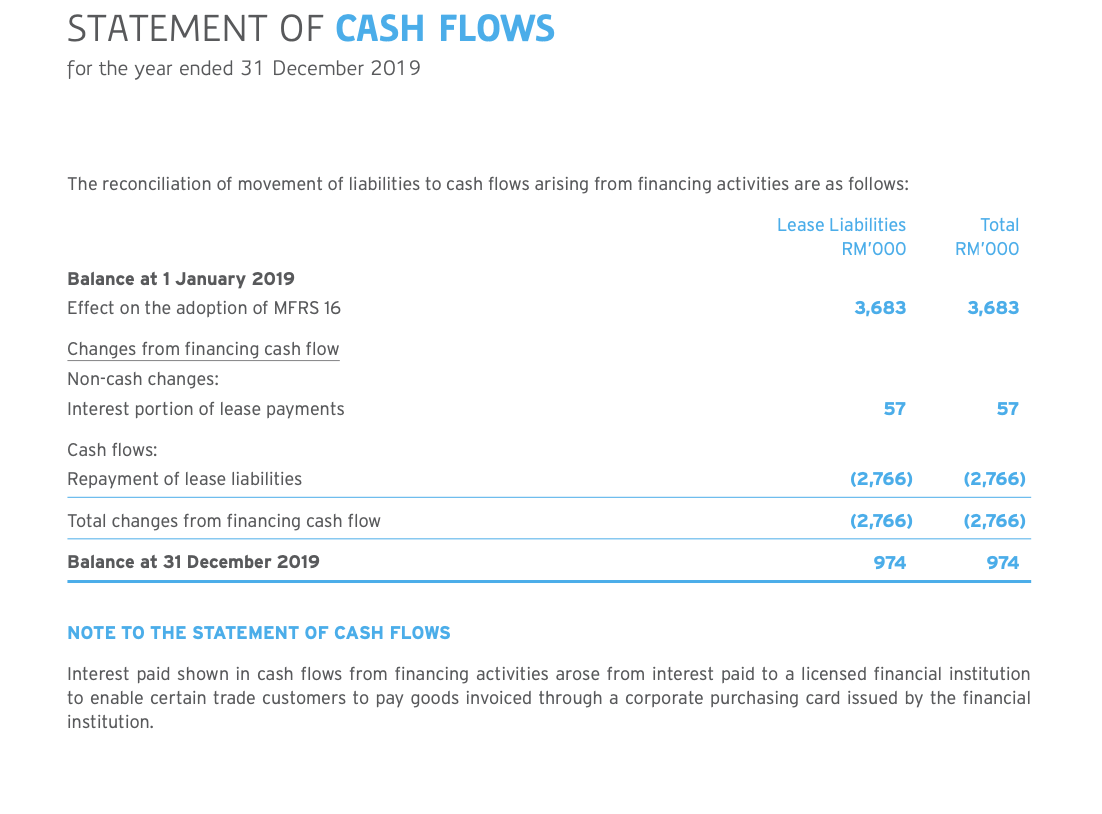
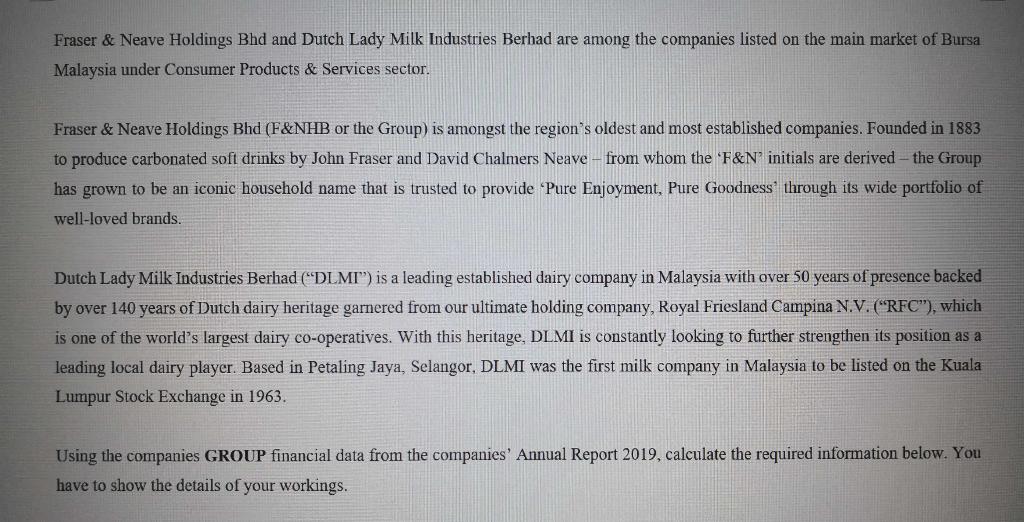
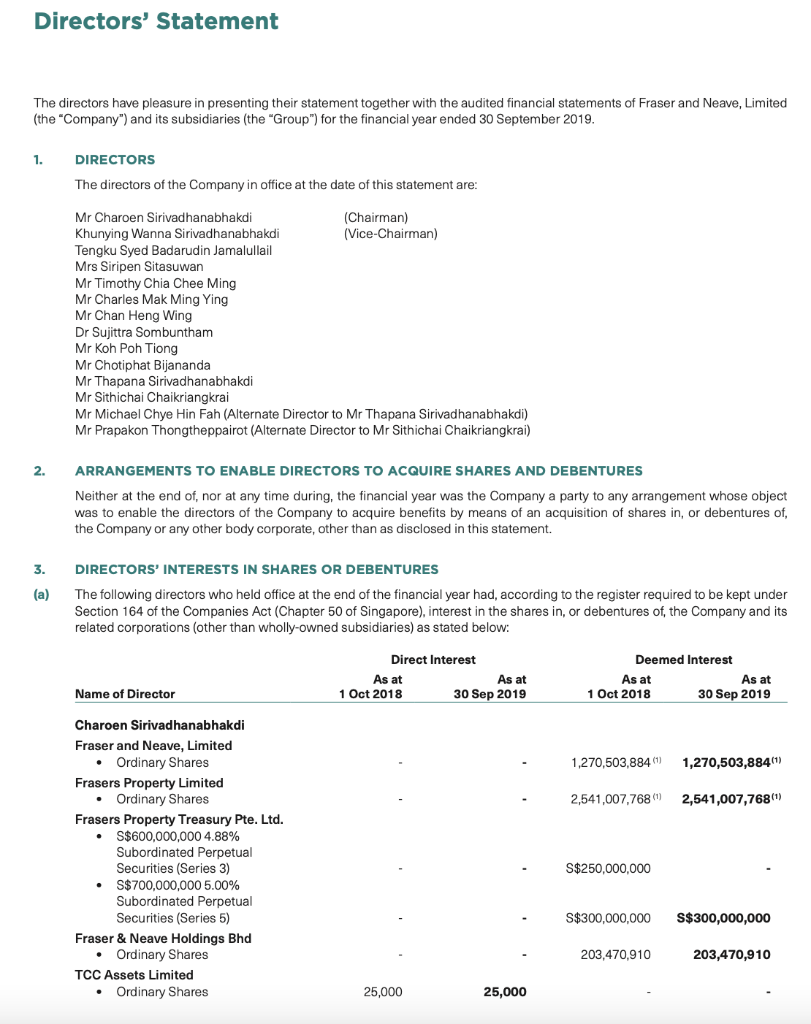
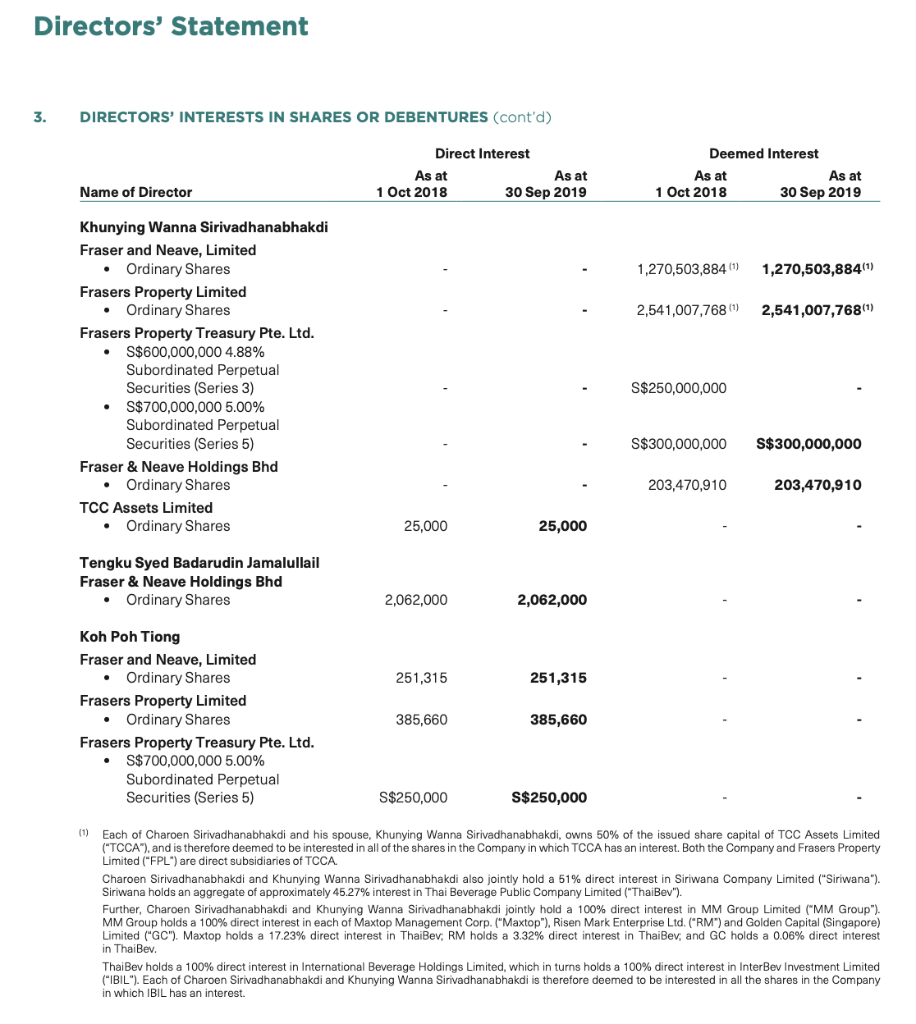
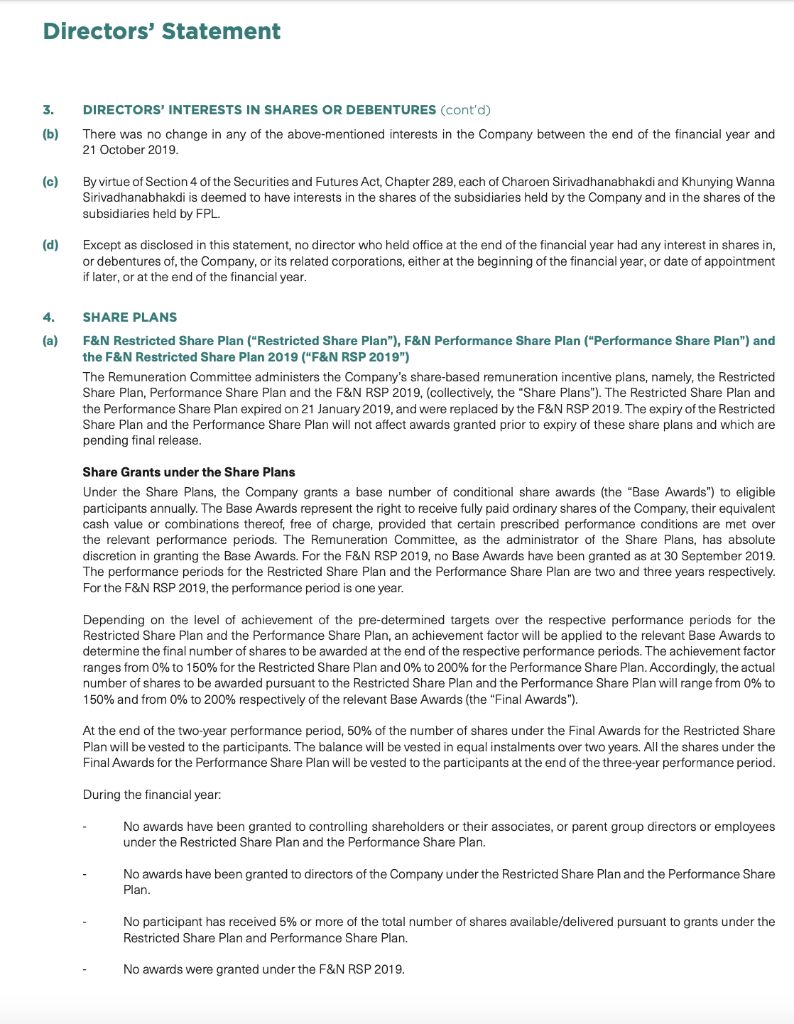
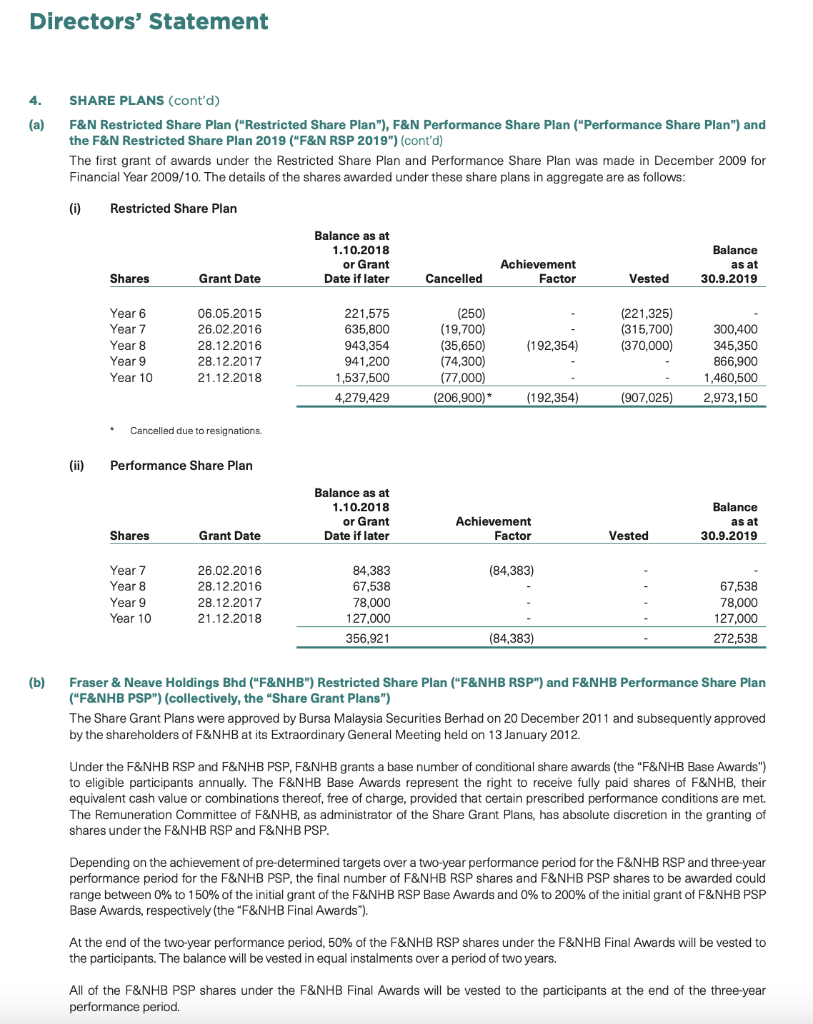
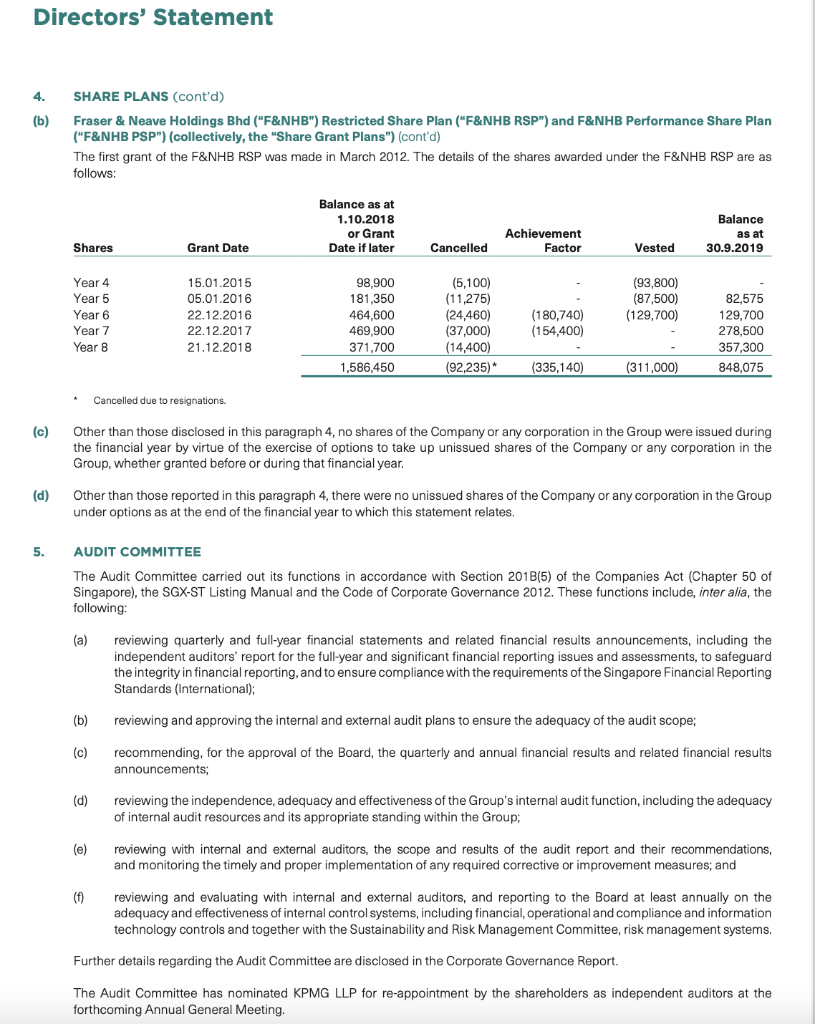
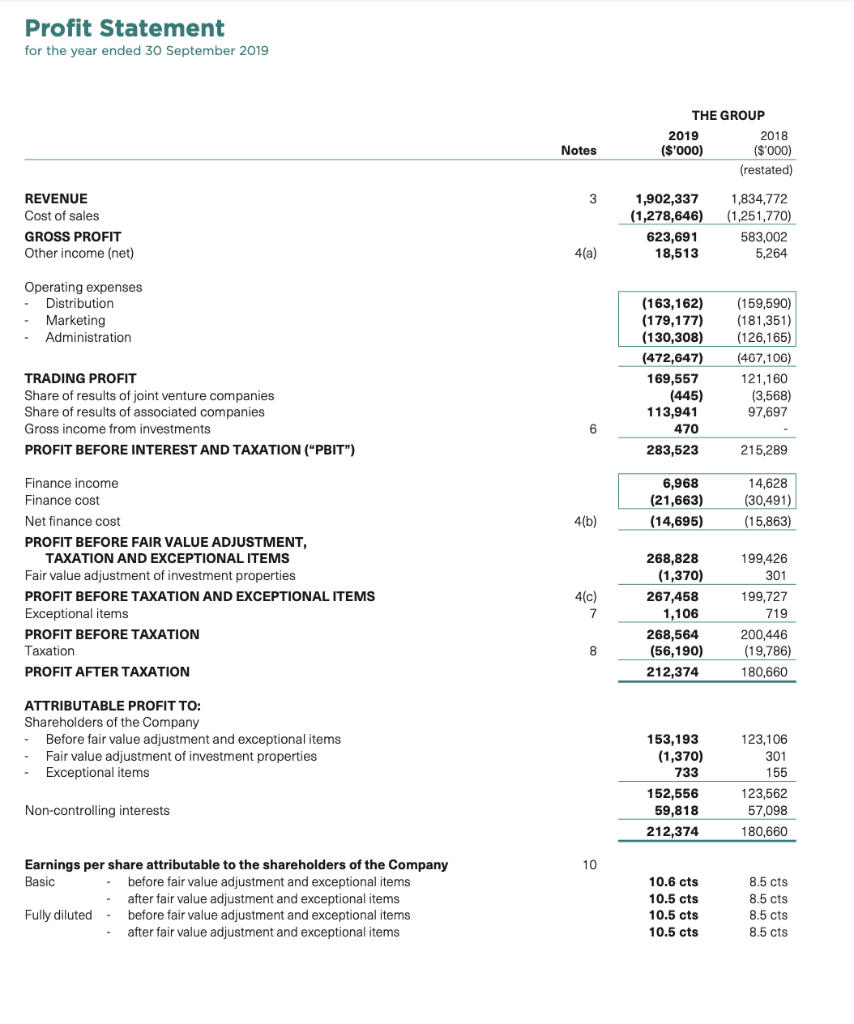
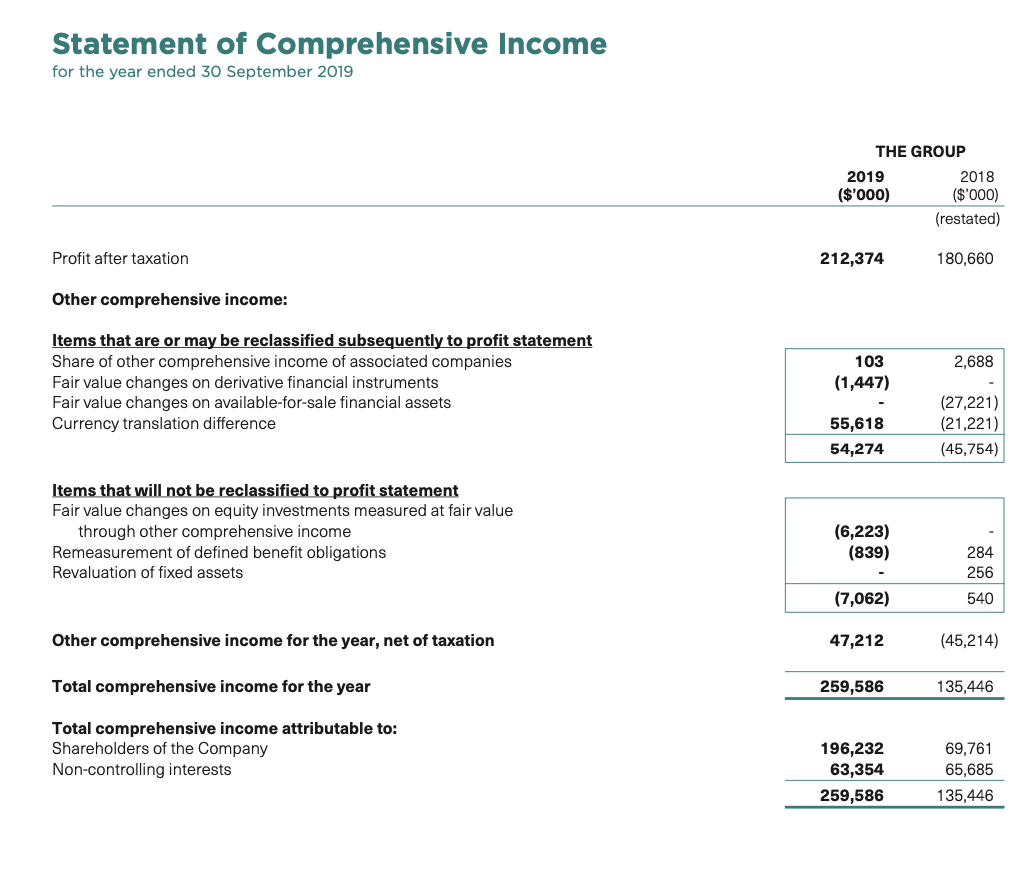
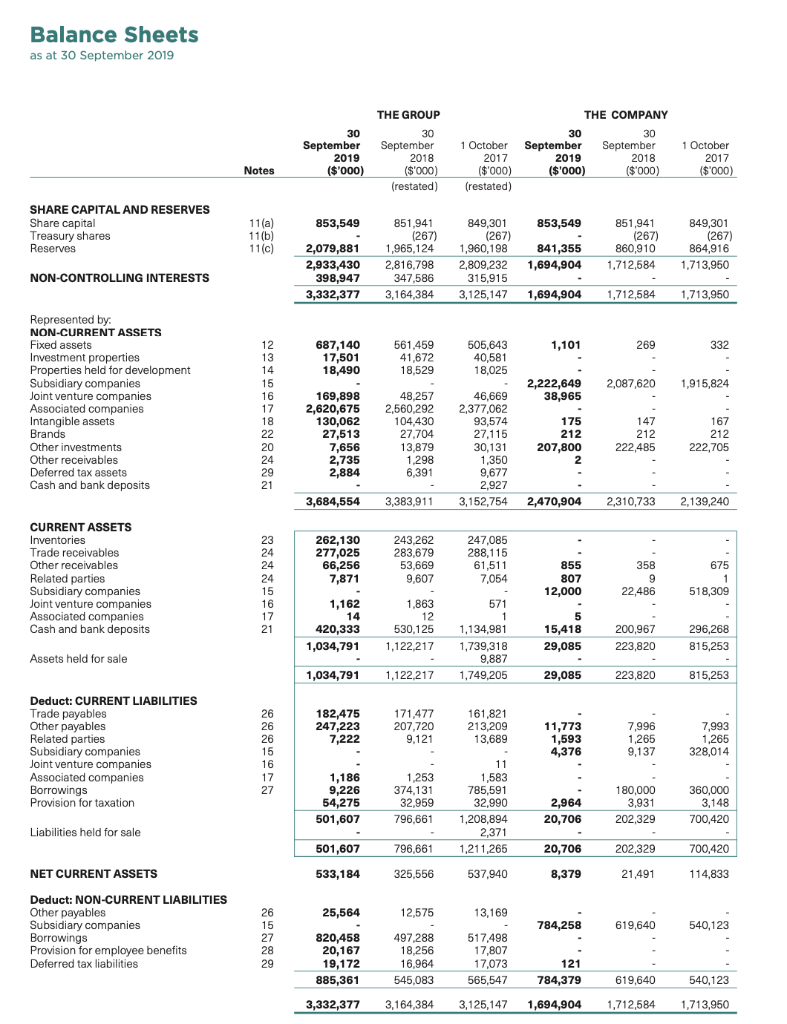
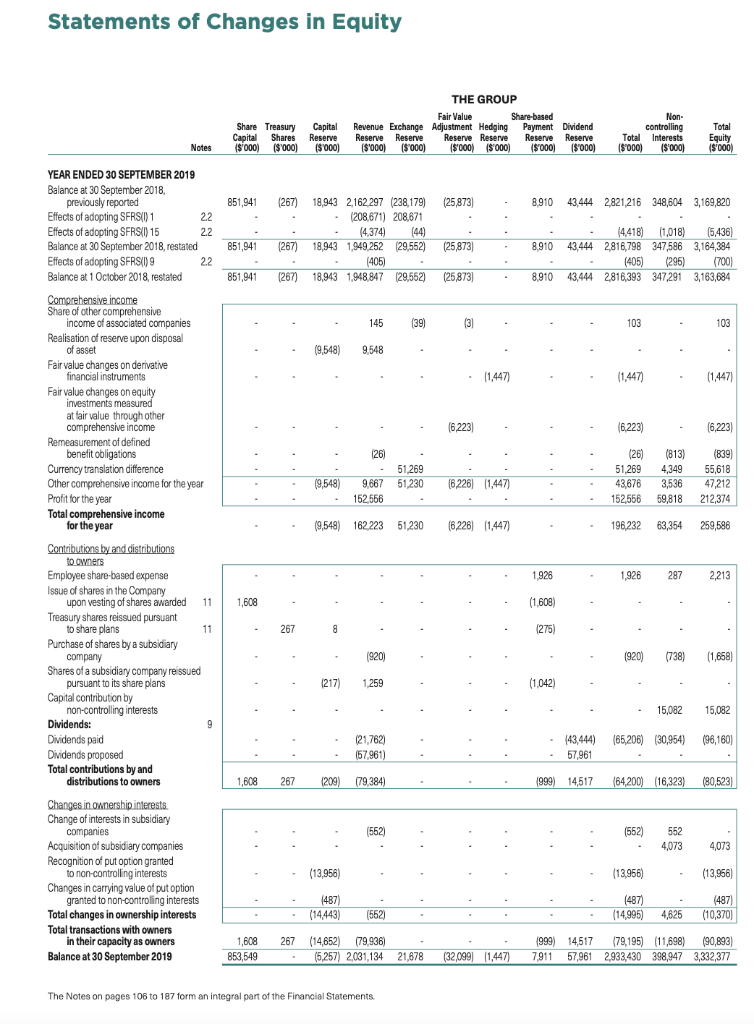
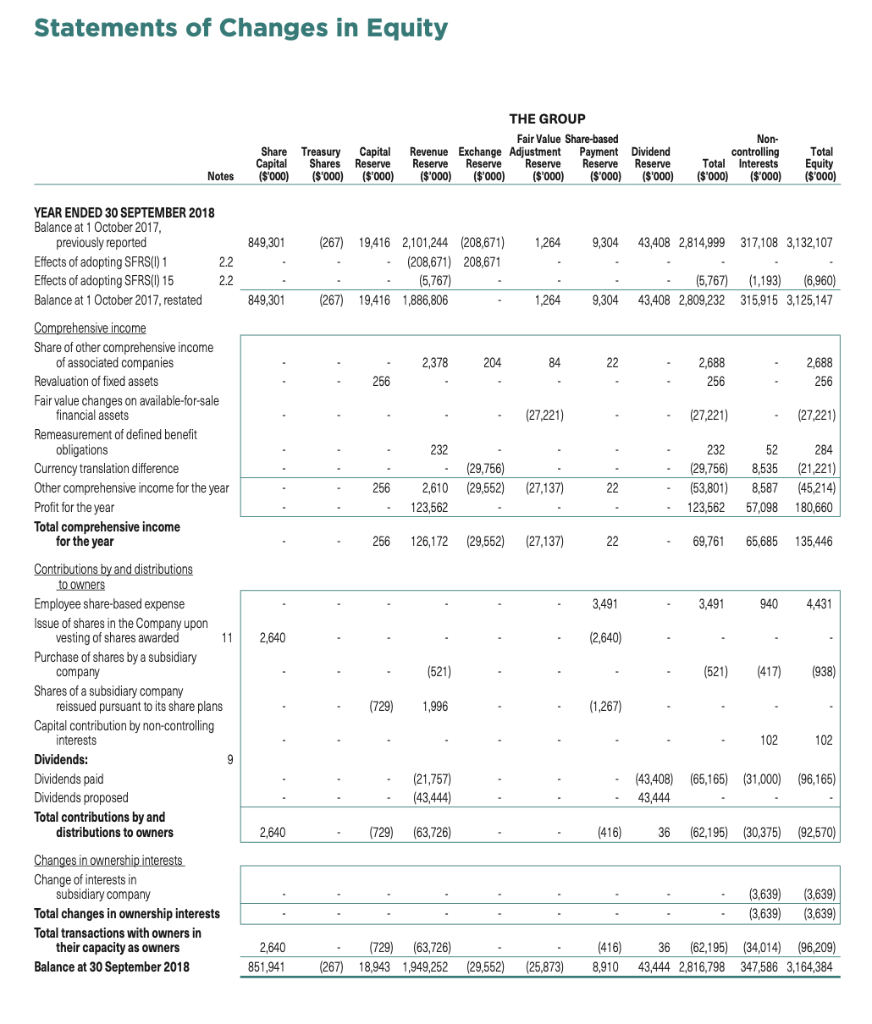
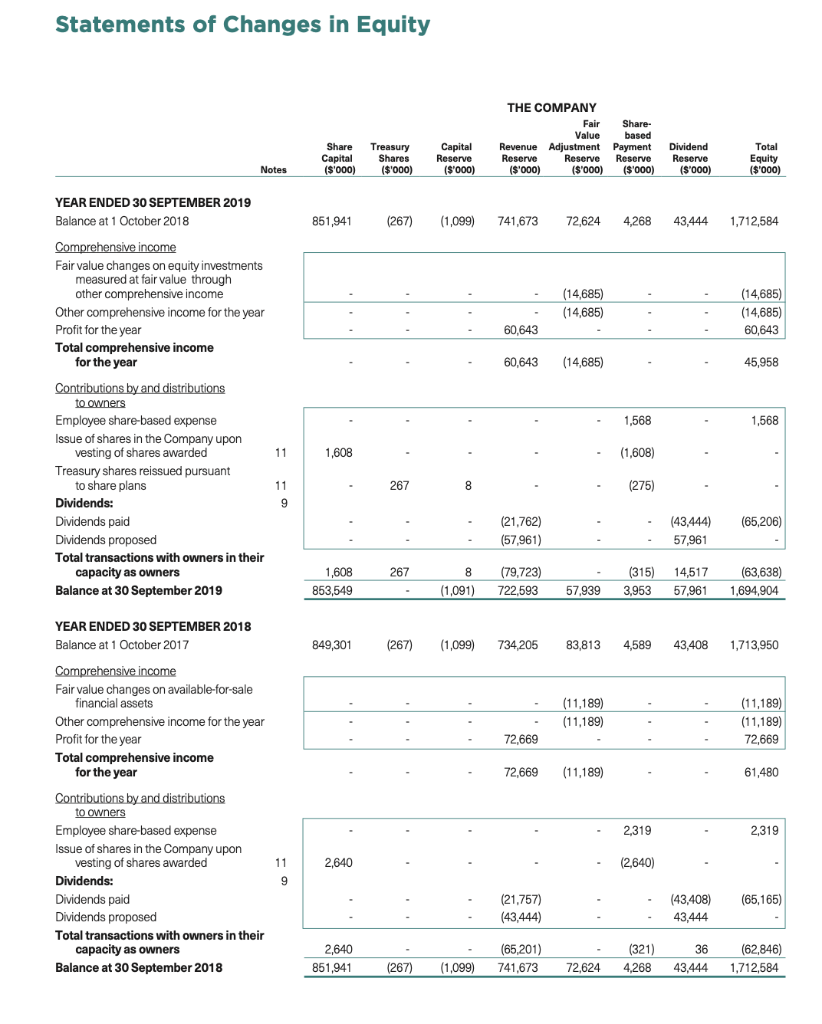
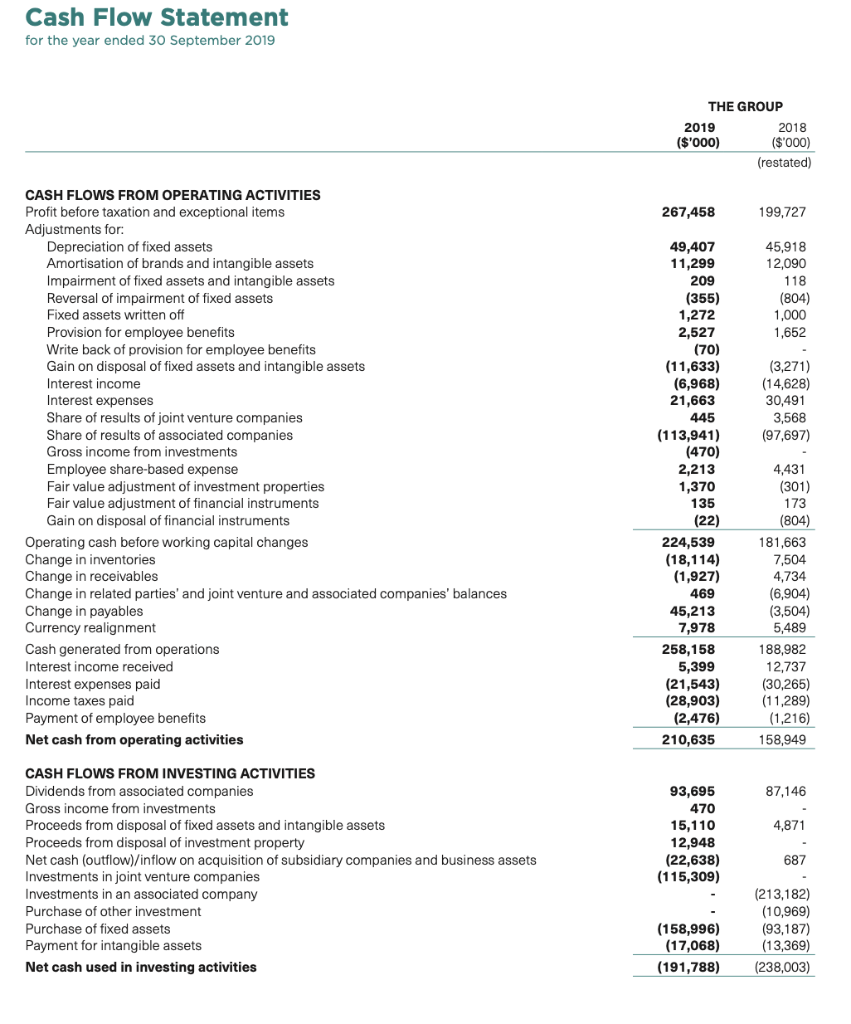
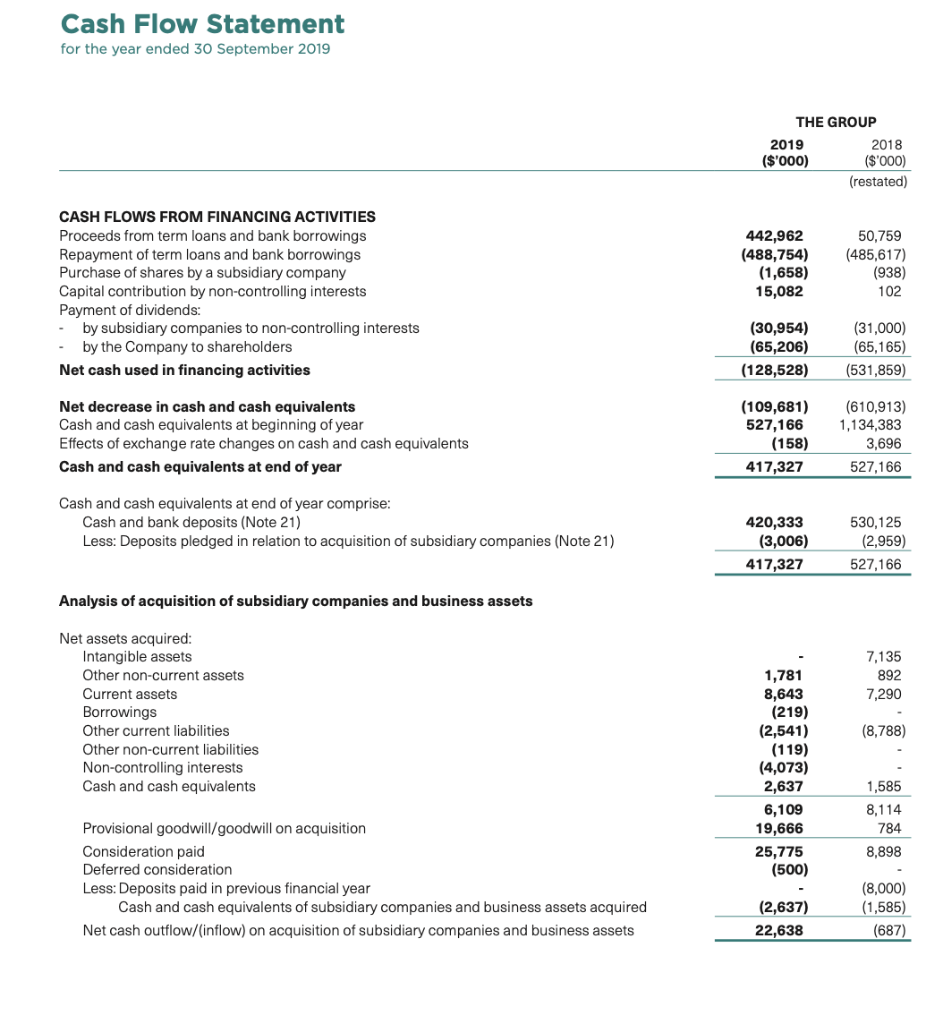
Fraser & Neave Holdings Bhd and Dutch Lady Milk Industries Berhad are among the companies listed on the main market of Bursa Malaysia under Consumer Products & Services sector. Fraser & Neave Holdings Bhd (F&NHB or the Group) is amongst the region's oldest and most established companies. Founded in 1883 to produce carbonated soft drinks by John Fraser and David Chalmers Neave - from whom the 'F&N initials are derived - the Group has grown to be an iconic household name that is trusted to provide 'Pure Enjoyment, Pure Goodness through its wide portfolio of well-loved brands. Dutch Lady Milk Industries Berhad (DLMI") is a leading established dairy company in Malaysia with over 50 years of presence backed by over 140 years of Dutch dairy heritage garnered from our ultimate holding company, Royal Friesland Campina N.V. ("RFC"), which is one of the world's largest dairy co-operatives. With this heritage, DLMI is constantly looking to further strengthen its position as a leading local dairy player. Based in Petaling Jaya, Selangor, DLMI was the first milk company in Malaysia to be listed on the Kuala Lumpur Stock Exchange in 1963. Using the companies GROUP financial data from the companies' Annual Report 2019, calculate the required information below. You have to show the details of your workings. a. Calculate the working capital for both companies for 2018 and 2019. (4 marks) b. Calculate the operating cycle for both companies for 2019. Assume all sales (revenue) are on credit. Use the amount of trade and other receivable amount in the calculations. (4 marks) 6. Calculate the cash cycle for both companies for 2019. (4 marks) d. Compare the operating cycle and cash cycle for both companies. Which company has a better operating and cash cycle? Justify your answer. (4 marks) e. In your opinion, what are the factors that affect the operating cycle and cash cycle of both companies. Is it possible for a company to have a negative cash cycle? (4 marks) f. The five Cs of credit is a system used by lenders to gauge the creditworthiness of potential borrowers. Briefly discuss each C with example. (5 marks) Directors' Statement The directors have pleasure in presenting their statement together with the audited financial statements of Fraser and Neave, Limited (the "Company") and its subsidiaries (the "Group") for the financial year ended 30 September 2019. 1. DIRECTORS The directors of the Company in office at the date of this statement are: Mr Charoen Sirivadhanabhakdi (Chairman) Khunying Wanna Sirivadhanabhakdi (Vice-Chairman) Tengku Syed Badarudin Jamalullail Mrs Siripen Sitasuwan Mr Timothy Chia Chee Ming Mr Charles Mak Ming Ying Mr Chan Heng Wing Dr Sujittra Sombuntham Mr Koh Poh Tiong Mr Chotiphat Bijananda Mr Thapana Sirivadhanabhakdi Mr Sithichai Chaikriangkrai Mr Michael Chye Hin Fah (Alternate Director to Mr Thapana Sirivadhanabhakdi) Mr Prapakon Thongtheppairot (Alternate Director to Mr Sithichai Chaikriangkrai) 2. ARRANGEMENTS TO ENABLE DIRECTORS TO ACQUIRE SHARES AND DEBENTURES Neither at the end of, nor at any time during, the financial year was the Company a party to any arrangement whose object was to enable the directors of the Company to acquire benefits by means of an acquisition of shares in, or debentures of, the Company or any other body corporate, other than as disclosed in this statement. 3. (a) DIRECTORS' INTERESTS IN SHARES OR DEBENTURES The following directors who held office at the end of the financial year had, according to the register required to be kept under Section 164 of the Companies Act (Chapter 50 of Singapore), interest in the shares in, or debentures of, the Company and its related corporations (other than wholly-owned subsidiaries) as stated below: Direct Interest As at As at 1 Oct 2018 30 Sep 2019 Deemed Interest As at As at 1 Oct 2018 30 Sep 2019 Name of Director 1,270,503,884(1) 1,270,503,88401) 2,541,007,7680 2,541,007,768(1) Charoen Sirivadhanabhakdi Fraser and Neave, Limited Ordinary Shares Frasers Property Limited Ordinary Shares Frasers Property Treasury Pte. Ltd. S$600,000,000 4.88% Subordinated Perpetual Securities (Series 3) S$700,000,000 5.00% Subordinated Perpetual Securities (Series 5) Fraser & Neave Holdings Bhd Ordinary Shares TCC Assets Limited Ordinary Shares S$250,000,000 S$300,000,000 S$300,000,000 . 203,470,910 203,470,910 25,000 25,000 Directors' Statement 3. DIRECTORS' INTERESTS IN SHARES OR DEBENTURES (cont'd) Direct Interest As at As at 1 Oct 2018 30 Sep 2019 Deemed Interest As at 1 Oct 2018 30 Sep 2019 As at Name of Director 1,270,503,884 (1) 1,270,503,884(1) 2,541,007,7681 2,541,007,76811) Khunying Wanna Sirivadhanabhakdi Fraser and Neave, Limited Ordinary Shares Frasers Property Limited Ordinary Shares Frasers Property Treasury Pte. Ltd. S$600,000,000 4.88% Subordinated Perpetual Securities (Series 3) S$700,000,000 5.00% Subordinated Perpetual Securities (Series 5) Fraser & Neave Holdings Bhd Ordinary Shares TCC Assets Limited Ordinary Shares S$250,000,000 S$300,000,000 S$300,000,000 203,470,910 203,470,910 25,000 25,000 Tengku Syed Badarudin Jamalullail Fraser & Neave Holdings Bhd Ordinary Shares 2,062,000 2,062,000 251,315 251,315 Koh Poh Tiong Fraser and Neave, Limited Ordinary Shares Frasers Property Limited Ordinary Shares Frasers Property Treasury Pte. Ltd. S$ 700,000,000 5.00% Subordinated Perpetual Securities (Series 5) 385,660 385,660 S$250,000 S$250,000 Each of Charoen Sirivadhanabhakdi and his spouse, Khunying Wanna Sirivadhanabhakdi, owns 50% of the issued share capital of TCC Assets Limited ("TCCA"), and is therefore deemed to be interested in all of the shares in the Company in which TCCA has an interest. Both the Company and Frasers Property Limited ("FPL") are direct subsidiaries of TCCA. Charoen Sirivadhanabhakdi and Khunying Wanna Sirivadhanabhakdi also jointly hold a 51% direct interest in Siriwana Company Limited ("Siriwana"). Siriwana holds an aggregate of approximately 45.27% interest in Thai Beverage Public Company Limited ("ThaiBev"). Further, Charoen Sirivadhanabhakdi and Khunying Wanna Sirivadhanabhakdi jointly hold a 100% direct interest in MM Group Limited ("MM Group"). MM Group holds a 100% direct interest in each of Maxtop Management Corp. ("Maxtop"), Risen Mark Enterprise Ltd. ("RM") and Golden Capital (Singapore) Limited ("GC"). Maxtop holds a 17.23% direct interest in ThaiBev, RM holds a 3.32% direct interest in ThaiBev, and GC holds a 0.06% direct interest in ThaiBev. ThaiBev holds a 100% direct interest in International Beverage Holdings Limited, which in turns holds a 100% direct interest in InterBev Investment Limited ("IBIL"). Each of Charoen Sirivadhanabhakdi and Khunying Wanna Sirivadhanabhakdi is therefore deemed to be interested in all the shares in the Company in which IBIL has an interest. Directors' Statement 3. (b) DIRECTORS' INTERESTS IN SHARES OR DEBENTURES (cont'd) There was no change in any of the above-mentioned interests in the Company between the end of the financial year and 21 October 2019. (c) By virtue of Section 4 of the Securities and Futures Act, Chapter 289, each of Charoen Sirivadhanabhakdi and Khunying Wanna Sirivadhanabhakdi is deemed to have interests in the shares of the subsidiaries held by the Company and in the shares of the subsidiaries held by FPL. (d) Except as disclosed in this statement, no director who held office at the end of the financial year had any interest in shares in, or debentures of the Company, or its related corporations, either at the beginning of the financial year, or date of appointment if later, or at the end of the financial year. 4. (a) SHARE PLANS F&N Restricted Share Plan ("Restricted Share Plan"), F&N Performance Share Plan ("Performance Share Plan") and the F&N Restricted Share Plan 2019 ("F&N RSP 2019") The Remuneration Committee administers the Company's share-based remuneration incentive plans, namely, the Restricted Share Plan, Performance Share Plan and the F&N RSP 2019, (collectively, the "Share Plans"). The Restricted Share Plan and the Performance Share Plan expired on 21 January 2019, and were replaced by the F&N RSP 2019. The expiry of the Restricted Share Plan and the Performance Share Plan will not affect awards granted prior to expiry of these share plans and which are pending final release. Share Grants under the Share Plans Under the Share Plans, the Company grants a base number of conditional share awards (the "Base Awards") to eligible participants annually. The Base Awards represent the right to receive fully paid ordinary shares of the Company, their equivalent cash value or combinations thereof, free of charge, provided that certain prescribed performance conditions are met over the relevant performance periods. The Remuneration Committee, as the administrator of the Share Plans, has absolute discretion in granting the Base Awards. For the F&N RSP 2019, no Base Awards have been granted as at 30 September 2019. The performance periods for the Restricted Share Plan and the Performance Share Plan are two and three years respectively. For the F&N RSP 2019, the performance period is one year. Depending on the level of achievement of the pre-determined targets over the respective performance periods for the Restricted Share Plan and the Performance Share Plan, an achievement factor will be applied to the relevant Base Awards to determine the final number of shares to be awarded at the end of the respective performance periods. The achievement factor ranges from 0% to 150% for the Restricted Share Plan and 0% to 200% for the Performance Share Plan. Accordingly, the actual number of s shares to be awarded pursuant to the Restricted Share Plan and the Performance Share Plan will range from 0% to 150% and from 0% to 200% respectively of the relevant Base Awards (the "Final Awards"). At the end of the two-year performance period, 50% of the number of shares under the Final Awards for the Restricted Share Plan will be vested to the participants. The balance will be vested in equal instalments over two years. All the shares under the Final Awards for the Performance Share Plan will be vested to the participants at the end of the three-year performance period. During the financial year: No awards have been granted to controlling shareholders or their associates, or parent group directors or employees under the Restricted Share Plan and the Performance Share Plan. under the Restricted Share Plan and the Performance Share No awards have been granted to directors of the Plan. No participant has received 5% or more of the total number of shares available/delivered pursuant to grants under the Restricted Share Plan and Performance Share Plan. No awards were granted under the F&N RSP 2019. Directors' Statement 4. (a) SHARE PLANS (cont'd) F&N Restricted Share Plan ("Restricted Share Plan"), F&N Performance Share Plan ("Performance Share Plan") and the F&N Restricted Share Plan 2019 ("F&N RSP 2019") (cont'd) The first grant of awards under the Restricted Share Plan and Performance Share Plan was made in December 2009 for Financial Year 2009/10. The details of the shares awarded under these share plans in aggregate are as follows: (i) Restricted Share Plan Balance as at 1.10.2018 or Grant Date if later Balance as at 30.9.2019 Achievement Factor Shares Grant Date Cancelled Vested Year 6 Year 7 06.05.2015 26.02.2016 28.12.2016 28.12.2017 21.12.2018 (221,325) (315,700) (370,000) Year 8 Year 9 (192,354) 221,575 635,800 943,354 941,200 1,537,500 4,279,429 (250) (19,700) (35,650) (74,300) (77,000) (206,900)* 300,400 345,350 866,900 1,460,500 2,973,150 Year 10 (192,354) (907,025) Cancelled due to resignations (ii) Performance Share Plan Balance as at 1.10.2018 or Grant Date if later Achievement Factor Balance as at 30.9.2019 Shares Grant Date Vested (84,383) Year 7 Year 8 Year 9 Year 10 26.02.2016 28.12.2016 28.12.2017 21.12.2018 84,383 67,538 78,000 127.000 356,921 67,538 78,000 127,000 272,538 (84,383) (b) Fraser & Neave Holdings Bhd ("F&NHB") Restricted Share Plan ("F&NHB RSP") and F&NHB Performance Share Plan ("F&NHB PSP") (collectively, the "Share Grant Plans") The Share Grant Plans were approved by Bursa Malaysia Securities Berhad on 20 December 2011 and subsequently approved by the shareholders of F&NHB at its Extraordinary General Meeting held on 13 January 2012 Under the F&NHB RSP and F&NHB PSP, F&NHB grants a base number of conditional share awards (the "F&NHB Base Awards") to eligible participants annually. The F&NHB Base Awards represent the right to receive fully paid shares of F&NHB, their equivalent cash value or combinations thereof, free of charge, provided that certain prescribed performance conditions are met. The Remuneration Committee of F&NHB, as administrator of the Share Grant Plans, has absolute discretion in the granting of shares under the F&NHB RSP and F&NHB PSP. Depending on the achievement of pre-determined targets over a two-year performance period for the F&NHB RSP and three-year performance period for the F&NHB PSP, the final number of F&NHB RSP shares and F&NHB PSP shares to be awarded could range between 0% to 150% of the initial grant of the F&NHB RSP Base Awards and 0% to 200% of the initial grant of F&NHB PSP Base Awards, respectively (the "F&NHB Final Awards"). At the end of the two-year performance period, 50% of the F&NHB RSP shares under the F&NHB Final Awards will be vested to the participants. The balance will be vested in equal instalments over a period of two years. All of the F&NHB PSP shares under the F&NHB Final Awards will be vested to the participants at the end of the three-year performance period. Directors' Statement 4. (b) SHARE PLANS (cont'd) Fraser & Neave Holdings Bhd ("F&NHB") Restricted Share Plan ("F&NHB RSP") and F&NHB Performance Share Plan ("F&NHB PSP") (collectively, the "Share Grant Plans") (cont'd) The first grant of the F&NHB RSP was made in March 2012. The details of the shares awarded under the F&NHB RSP are as follows: Balance as at 1.10.2018 or Grant Date if later Achievement Factor Balance as at 30.9.2019 Shares Grant Date Cancelled Vested Year 4 Year 5 Year 6 Year 7 Year 8 15.01.2015 05.01.2016 22.12.2016 22.12.2017 21.12.2018 (93,800) (87,500) (129,700) 98,900 181,350 464,600 469,900 371,700 1,586,450 (5,100) (11,275) (24,460) (37,000) (14,400) (92,235)* (180,740) (154,400) 82,575 129,700 278,500 357,300 848,075 (335,140) (311,000) Cancelled due to resignations. (c) Other than those disclosed in this paragraph 4, no shares of the Company or any corporation in the Group were issued during the financial year by virtue of the exercise of options to take up unissued shares of the Company or any corporation in the Group, whether granted before or during that financial year. (d) Other than those reported in this paragraph 4, there were no unissued shares of the Company or any corporation in the Group under options as at the end of the financial year to which this statement relates. 5. AUDIT COMMITTEE The Audit Committee carried out its functions in accordance with Section 2018(5) of the Companies Act (Chapter 50 of Singapore), the SGX-ST Listing Manual and the Code of Corporate Governance 2012. These functions include, inter alia, the following: (a) reviewing quarterly and full-year financial statements and related financial results announcements, including the independent auditors' report for the full-year and significant financial reporting issues and assessments, to safeguard the integrity in financial reporting, and to ensure compliance with the requirements of the Singapore Financial Reporting Standards (International); (b) reviewing and approving the internal and external audit plans to ensure the adequacy of the audit scope; (c) recommending, for the approval of the Board, the quarterly and annual financial results and related financial results announcements; (d) reviewing the independence, adequacy and effectiveness of the Group's internal audit function, including the adequacy of internal audit resources and its appropriate standing within the Group: (e) reviewing with internal and external auditors, the scope and results of the audit report and their recommendations, and monitoring the timely and proper implementation of any required corrective or improvement measures; and (f) reviewing and evaluating with internal and external auditors, and reporting to the Board at least annually on the adequacy and effectiveness of internal control systems, including financial, operational and compliance and information technology controls and together with the Sustainability and Risk Management Committee, risk management systems. Further details regarding the Audit Committee are disclosed in the Corporate Governance Report. The Audit Committee has nominated KPMG LLP for re-appointment by the shareholders as independent auditors at the forthcoming Annual General Meeting Directors' Statement 6. INDEPENDENT AUDITORS The independent auditors, KPMG LLP, have expressed their willingness to accept re-appointment. 7. OPINION OF THE DIRECTORS In the opinion of the directors, (i) the consolidated financial statements of the Group and the balance sheet and statement of changes in equity of the Company are drawn up so as to give a true and fair view of the financial position of the Group and of the Company as at 30 September 2019 and the financial performance, changes in equity and cash flows of the Group and the changes in equity of the Company for the financial year ended 30 September 2019; and (ii) at the date of this statement, there are reasonable grounds to believe that the Company will be able to pay its debts as and when they fall due. On behalf of the Board SIRIPEN SITASUWAN Director SITHICHAI CHAIKRIANGKRAI Director 14 November 2019 Independent Auditors' Report Members of the Company Fraser and Neave, Limited Report on the audit of the financial statements Opinion We have audited the financial statements of Fraser and Neave, Limited ('the Company') and its subsidiaries (the Group'), which comprise the consolidated balance sheet of the Group and the balance sheet of the Company as at 30 September 2019, the consolidated statement of changes in equity of the Group and the statement of changes in equity of the Company and the consolidated profit statement, consolidated statement of comprehensive income, and consolidated cash flow statement of the Group for the year then ended, and notes to the financial statements, including a summary of significant accounting policies, as set out on pages 98 to 187. In our opinion, the accompanying consolidated financial statements of the Group and the balance sheet and statement of changes in equity of the Company are properly drawn up in accordance with the provisions of the Companies Act, Chapter 50 (the Act') and Singapore Financial Reporting Standards (International) ("SFRS(I)s") so as to give a true and fair view of the consolidated financial position of the Group and the financial position of the Company as at 30 September 2019 and of the consolidated financial performance, consolidated changes in equity and consolidated cash flows of the Group and changes in equity of the Company for the year ended on that date. Basis for opinion We conducted our audit in accordance with Singapore Standards on Auditing ('SSAs"). Our responsibilities under those standards are further described in the 'Auditors' responsibilities for the audit of the financial statements' section of our report. We are independent of the Group in accordance with the Accounting and Corporate Regulatory Authority Code of Professional Conduct and Ethics for Public Accountants and Accounting Entities ('ACRA Code") together with the ethical requirements that are relevant to our audit of the financial statements in Singapore, and we have fulfilled our other ethical responsibilities in accordance with these requirements and the ACRA Code. We believe that the audit evidence we have obtained is sufficient and appropriate to provide a basis for our opinion. Key audit matters Key audit matters are those matters that in our professional judgement, were of most significance in our audit of the financial statements of the current period. These matters were addressed in the context of our audit of the financial statements as a whole, and in forming our opinion thereon, and we do not provide a separate opinion on these matters. Impairment of fixed assets and investments in subsidiaries (Refer to Note 2.9, Note 2.19, Note 12 and Note 15 to the financial statements) The key audit matter Fixed assets constitute 14.6% of the Group's total assets and investment in subsidiaries constitute 88.9% of the Company's total assets as at 30 September 2019. How the matter was addressed in our audit Our procedures included, among others, assessing the appropriateness of the methodology used in determining the recoverable amount of the fixed assets and investment in subsidiaries. When there are indicators of impairment noted in a business segment, the Group will estimate the recoverable amount of the fixed assets and investment in subsidiaries at the Company level based on discounted future cash flows expected to be generated from the business segment. The net present value of the forecast cash flows is derived from profit forecasts which include key assumptions such as sales growth rates and gross profit margins for the next 5 years, and discount rate as well as terminal growth rate. We also assessed the reasonableness of the key assumptions used in the 5-year profit forecasts by comparing sales growth rates and gross profit margins to past performance and future plans. We also compared the discount rates applied to cost of capital of comparable listed companies and compared the terminal growth rate to macroeconomic indicators. We evaluated the sensitivity of the profit forecasts by considering the downside scenarios against reasonably plausible changes to the key assumptions. The assessment of management's judgements in arriving at these key assumptions is a key focus area of our audit. Our findings - We found the methodology used to be appropriate and key assumptions applied in the impairment testing to be appropriate. Independent Auditors' Report Members of the Company Fraser and Neave, Limited Impairment of goodwill and intangible assets (including brands) (Refer to Note 2.13, Note 2.14, Note 2.19, Note 18. Note 19 and Note 22 to the financial statements) The key audit matter As at 30 September 2019, the Group has goodwill of $95.0 million mainly relating to the printing and publishing group and beverages group, and intangible assets (including brands) of $62.6 million mainly relating to brands owned by the Group. How the matter was addressed in our audit We assessed the determination of the operating units that goodwill is allocated to based on our understanding of the nature of the Group's business. The Group will estimate the recoverable amount of goodwill and intangible assets with indicators of impairment based on discounted future cash flows expected to be generated from the respective operating unit. The net present value of the forecast cash flows derived from profit forecasts which include key assumptions such as sales growth and gross profit margins for the next 3 to 5 years, discount rate and terminal growth rate for the operating units which the goodwill and intangible assets are allocated to For goodwill and intangible assets with indicators of impairment, our procedures included, among others, assessing the appropriateness of the methodology used in determining the recoverable amount of the goodwill and intangible assets. We assessed the reasonableness of the key assumptions used in the 3 to 5 year profit forecasts, by comparing sales growth rates and gross profit margins to past performance and future plans. We also compared the discount rates applied to the cost of capital of comparable listed companies and compared the terminal growth rate to macroeconomic indicators. We evaluated the sensitivity of the profit forecasts by considering the downside scenarios against reasonably plausible changes to the key assumptions. As there are judgements and estimation involved in the preparation of the discounted future cash flows and determination of certain key inputs, this is a key focus area in our audit. Our findings - We found the methodology used to be appropriate and key assumptions applied in the impairment testing to be appropriate. Other information Management is responsible for the other information contained in the annual report. Other information is defined as all information in the annual report other than the financial statements and our auditors' report thereon. We have obtained all other information prior to the date of this auditors' report except for the Shareholding Statistics which is expected to be made available to us after that date. Our opinion on the financial statements does not cover the other information and we do not and will not express any form of assurance conclusion thereon. In connection with our audit of the financial statements, our responsibility is to read the other information identified above and, in doing so, consider whether the other information is materially inconsistent with the financial statements or our knowledge obtained the audit or otherwise appears to be materially misstated. If, based on the work we have performed on the other information that we obtained prior to the date of this auditors' report, we conclude that there is a material misstatement of this other information, we are required to report that fact. We have nothing to report in this regard. When we read the Shareholding Statistics, if we conclude that there is a material statement therein, we are required to communicate the matter to those charged with governance and take appropriate actions in accordance with SSAs. Responsibilities of management and directors for the financial statements Management is responsible for the preparation of financial statements that give a true and fair view in accordance with the provisions of the Act and SFRS(I)s, and for devising and maintaining a system of internal accounting controls sufficient to provide a reasonable assurance that assets are safeguarded against loss from unauthorised use or disposition; and transactions are properly authorised and that they are recorded as necessary to permit the preparation of true and fair financial statements and to maintain accountability of assets. In preparing the financial statements, management is responsible for assessing the Group's ability to continue as a going concern, disclosing, as applicable, matters related to going concern and using the going concern basis of accounting unless management either intends to liquidate the Group or to cease operations, or has no realistic alternative but to do so. The directors' responsibilities include overseeing the Group's financial reporting process. Independent Auditors' Report Members of the Company Fraser and Neave, Limited Auditors' responsibilities for the audit of the financial statements Our objectives are to obtain reasonable assurance about whether the financial statements as a whole are free from material misstatement, whether due to fraud or error, and to issue an auditors' report that includes our opinion. Reasonable assurance is a high level of assurance, but is not a guarantee that an audit conducted in accordance with SSAs will always detect a material misstatement when it exists. Misstatements can arise from fraud or error and are considered material if, individually or in the aggregate, they could reasonably be expected to influence the economic decisions of users taken on the basis of these financial statements. As part of an audit in accordance with SSAs, we exercise professional judgement and maintain professional scepticism throughout the audit. We also: . Identify and assess the risks of material misstatement of the financial statements, whether due to fraud or error, design and perform audit procedures responsive to those risks, and obtain audit evidence that is sufficient and appropriate to provide a basis for our opinion. The risk of not detecting a material misstatement resulting from fraud is higher than for one resulting from error, as fraud may involve collusion, forgery, intentional omissions, misrepresentations, or the override of internal controls. Obtain an understanding of internal controls relevant to the audit in order to design audit procedures that are appropriate in the circumstances, but not for the purpose of expressing an opinion on the effectiveness of the Group's internal controls. Evaluate the appropriateness of accounting policies used and the reasonableness of accounting estimates and related disclosures made by management. Conclude on the appropriateness of management's use of the going concern basis of accounting and, based on the audit evidence obtained, whether a material uncertainty exists related to events or conditions that may cast significant doubt on the Group's ability to continue as a going concern. If we conclude that a material uncertainty exists, we are required draw attention in our auditors' report to the related disclosures in the financial statements or, if such disclosures are inadequate, to modify our opinion. Our conclusions are based on the audit evidence obtained up to the date of our auditors' report. However, future events or conditions may cause the Group to cease to continue as a going concern. Evaluate the overall presentation, structure and content of the financial statements, including the disclosures, and whether the financial statements represent the underlying transactions and events in a manner that achieves fair presentation. Obtain sufficient appropriate audit evidence regarding the financial information of the entities or business activities within the Group to express an opinion on the consolidated financial statements. We are responsible for the direction, supervision and performance of the group audit. We remain solely responsible for our audit opinion. We communicate with the directors regarding, among other matters, the planned scope and timing of the audit and significant audit findings, including any significant deficiencies in internal controls that we identify during our audit. We also provide the directors with a statement that we have complied with relevant ethical requirements regarding independence, and communicate with them all relationships and other matters that may reasonably be thought to bear on our independence, and where applicable, related safeguards. From the matters communicated with the directors, we determine those matters that were of most significance in the audit of the financial statements of the current period and are therefore the key audit matters. We describe these matters in our auditors' report unless the law or regulations preclude public disclosure about the matter or when, in extremely rare circumstances, we determine that a matter should not be communicated in our report because the adverse consequences of doing so would reasonably be expected to outweigh the public interest benefits of such communication Report on other legal and regulatory requirements In our opinion, the accounting and other records required by the Act to be kept by the Company and by those subsidiary corporations incorporated in Singapore of which we are the auditors have been properly kept in accordance with the provisions of the Act. The engagement partner on the audit resulting in this independent auditors' report is Quek Shu Ping. KPMG LLP Public Accountants and Chartered Accountants Singapore 14 November 2019 Profit Statement for the year ended 30 September 2019 Notes THE GROUP 2019 2018 ($'000) ($'000) (restated) 3 REVENUE Cost of sales GROSS PROFIT Other income (net) 1,902,337 (1,278,646) 623,691 18,513 1,834,772 (1,251,770) 583,002 5,264 4(a) Operating expenses Distribution Marketing Administration (163,162) (179,177) (130,308) (472,647) 169,557 (445) 113,941 470 283,523 (159,590) (181,351) (126,165) (467,100) 121,160 (3,568) 97,697 TRADING PROFIT Share of results of joint venture companies Share of results of associated companies Gross income from investments PROFIT BEFORE INTEREST AND TAXATION ("PBIT") 6 215,289 6,968 (21,663) (14,695) 14,628 (30,491) (15,863) 4(b) Finance income Finance cost Net finance cost PROFIT BEFORE FAIR VALUE ADJUSTMENT, TAXATION AND EXCEPTIONAL ITEMS Fair value adjustment of investment properties PROFIT BEFORE TAXATION AND EXCEPTIONAL ITEMS Exceptional items PROFIT BEFORE TAXATION Taxation PROFIT AFTER TAXATION 4(c) 7 268,828 (1,370) 267,458 1,106 268,564 (56,190) 212,374 199,426 301 199,727 719 200,446 (19,786) 180,660 8 ATTRIBUTABLE PROFIT TO: Shareholders of the Company Before fair value adjustment and exceptional items Fair value adjustment of investment properties Exceptional items 153,193 (1,370) 733 152,556 59,818 212,374 123,106 301 155 123,562 57,098 180,660 Non-controlling interests 10 Earnings per share attributable to the shareholders of the Company Basic before fair value adjustment and exceptional items after fair value adjustment and exceptional items Fully diluted before fair value adjustment and exceptional items after fair value adjustment and exceptional items 10.6 cts 10.5 cts 10.5 cts 10.5 cts 8.5 cts 8.5 cts 8.5 cts 8.5 cts Statement of Comprehensive Income for the year ended 30 September 2019 THE GROUP 2019 2018 ($'000) ($'000) (restated) Profit after taxation 212,374 180,660 Other comprehensive income: 2,688 Items that are or may be reclassified subsequently to profit statement Share of other comprehensive income of associated companies Fair value changes on derivative financial instruments Fair value changes on available-for-sale financial assets Currency translation difference 103 (1,447) 55,618 54,274 (27,221) (21,221) (45,754) Items that will not be reclassified to profit statement Fair value changes on equity investments measured at fair value through other comprehensive income Remeasurement of defined benefit obligations Revaluation of fixed assets (6,223) (839) 284 256 (7,062) 540 Other comprehensive income for the year, net of taxation 47,212 (45,214) Total comprehensive income for the year 259,586 135,446 Total comprehensive income attributable to: Shareholders of the Company Non-controlling interests 196,232 63,354 259,586 69,761 65,685 135,446 Balance Sheets as at 30 September 2019 30 September 2019 ($'000) THE GROUP 30 September 2018 ($'000) (restated) THE COMPANY 30 30 September September 2019 2018 ($'000) ($'000) 1 October 2017 ($'000) (restated) 1 October 2017 ($'000) Notes SHARE CAPITAL AND RESERVES Share capital Treasury shares Reserves 853,549 853,549 11(a) 11(b) 11(c) 851,941 (267) 1,965,124 2,816,798 347,586 3,164,384 849,301 (267) 1,960,198 2,809,232 315,915 3,125,147 2,079,881 2,933,430 398,947 3,332,377 841,355 1,694,904 851,941 (267) ) 860,910 1,712,584 849,301 (267) 864,916 1,713,950 NON-CONTROLLING INTERESTS - 1,694,904 1,712,584 1,713,950 269 332 687,140 17,501 18,490 561,459 41,672 18,529 2,087,620 1,915,824 Represented by NON-CURRENT ASSETS Fixed assets Investment properties Properties held for development Subsidiary companies Joint venture companies Associated companies Intangible assets Brands Other investments Other receivables Deferred tax assets Cash and bank deposits 12 13 14 15 16 17 18 22 20 24 29 21 169,898 2,620,675 130,062 27,513 7,656 2,735 2,884 48,257 2,560,292 104,430 27.704 13,879 1,298 6,391 505,643 1,101 40,581 18,025 2,222,649 46,669 38,965 2,377,062 93,574 175 27,115 212 30,131 207,800 1,350 2 9,677 2,927 3,152,754 2,470,904 147 212 222,485 167 212 222,705 3,684,554 3,383,911 2,310,733 2,139,240 243,262 CURRENT ASSETS Inventories Trade receivables Other receivables Related parties Subsidiary companies Joint venture companies Associated companies Cash and bank deposits 23 24 24 24 15 262,130 277,025 66,256 7,871 283,679 53,669 9,607 247,085 288,115 61,511 7,054 855 807 12,000 35B 9 22,486 675 1 518,309 16 17 21 1,162 14 420,333 1,034,791 1,863 12 530,125 1,122,217 571 1 1,134,981 1,739,318 9,887 1,749,205 5 15,418 29,085 200,967 223,820 296,268 815,253 Assets held for sale 1,034,791 1,122,217 29,085 223,820 815,253 182,475 247,223 7,222 171,477 207,720 9.121 161,821 213,209 13,689 7,996 Deduct: CURRENT LIABILITIES Trade payables Other payables Related parties Subsidiary companies Joint venture companies Associated companies Borrowings Provision for taxation 26 26 26 15 16 17 11,773 1,593 4,376 1,265 9,137 7,993 1,265 328,014 27 1,186 9,226 54,275 501,607 1,253 374,131 32,959 796,661 11 1,583 785,591 32,990 1,208,894 2,371 1,211,265 2,964 20,706 180,000 3,931 202,329 360,000 3,148 700,420 Liabilities held for sale 796,661 20,706 202,329 700,420 501,607 533,184 NET CURRENT ASSETS 325,556 537,940 8,379 21.491 114,833 25,564 12,575 13,169 784,258 Deduct: NON-CURRENT LIABILITIES Other payables Subsidiary companies Borrowings Provision for employee benefits Deferred tax liabilities 619,640 540,123 26 15 27 28 29 820,458 20,167 19,172 885,361 497288 18,256 16,964 545.083 517,498 17,807 17,073 565.547 121 784,379 619,640 540,123 618.640 3,332,377 3,164,384 3,125,147 1,694,904 1,712,584 1,713,950 Statements of Changes in Equity Share Treasury Capital Shares ($ 000) ($ 000) Capital Reserve ($ 000) THE GROUP Fair Value Share-based Revenue Exchange Adjustment Hedging Payment Dividend Reserve Reserve Reserve Reserve Reserve Reserve ( 1$'000) ($ 000) $ 000) ($ 000) ($ 000) ($ 000) Non- controlling Total Interests ($ 000) ($ 000) Total Equity ($ 000) Notes 851,941 (25,873) 8,910 43,444 2,821,216 348,604 3,169,820 851,941 (267) 18,943 2,162 297 (238,179) (208,671) 208,671 14.374) (44) (267) 18,943 1949 252 (29,552) (405) ) (267) 18,943 1948,847 29,562) (258731 4.41B) (1,018) (5,436) 8,910 43,444 2,816,798 347,586 3,164,384 (405) (295) (700) 8,910 43,444 2,816,393 347,291 3,163,684 851,941 (25,873) 145 (39) ( (3) 103 103 (9,548) 9,548 (1,447) (1,447) (1,447) (6223) 6,223) (6,223) (26) 51,269 9,667 51 230 152 556 (26) 51,269 43,676 152,556 (6226) (1,447) (813) 4,349 3,536 59,818 19,548) (839 55,618 47,212 212,374 19,548) 162 223 51,230 16,226) (1,447) 196,232 63,354 259,586 YEAR ENDED 30 SEPTEMBER 2019 Balance at 30 September 2018, previously reported Effects of adopting SFRS/11 2.2 Effects of adopting SFRS(I) 15 2.2 Balance at 30 September 2018, restated Effects of adopting SFRS19 22 Balance at 1 October 2018, restated Comprehensive income Share of other comprehensive income of associated companies Realisation of reserve upon disposal of asset Fair value changes on derivative financial instruments Fair value changes on equity investments measured at fair value through other comprehensive income Remeasurement of defined benefit obligations Currency translation difference Other comprehensive income for the year Profit for the year Total comprehensive income for the year Contributions by and distributions to owners Employee share-based expense Issue of shares in the Company upon vesting of shares awarded 11 Treasury shares reissued pursuant to share plans 11 Purchase of shares by a subsidiary company Shares of a subsidiary company reissued pursuant to its share plans Capital contribution by non-controlling interests Dividends: 9 Dividends paid Dividends proposed Total contributions by and distributions to owners Changes in ownership interests Change of interests in subsidiary companies Acquisition of subsidiary companies Recognition of put option granted to non-controlling interests Changes in carrying value of put option granted to non-controlling interests Total changes in ownership interests Total transactions with owners in their capacity as owners Balance at 30 September 2019 1928 1.926 287 2,213 1,608 (1.608) 267 8 275 (920) (920) ( (738) (1,658 1217) 1.259 (1.042 15,062 15,082 - (96,160 121,762) 157,961) 143,444) (65,206) (30,954) ) 57,961 1,608 267 1209) (79,384) 1999) 14,517 (64,200) (16,323) (80,523) (552) (552) 552 4,073 4,073 (13,956) - (13,956) (13,956) (487) (14,443) (487) (14,995) (487) (10,370) (552) 4,625 267 1,608 853,549 (14,652) 179.936) 15,257) 2031,134 (999) 14,517 (79,195) (11,698) (90,893) 7911 57,961 2933,430 398,947 3,332,377 21,678 (32,099) (1,447) The Notes on pages 108 to 187 form an integral part of the Financial Statements Statements of Changes in Equity THE COMPANY Fair Share- Value based Revenue Adjustment Payment Reserve Reserve Reserve ('000) ($'000) ($'000) Share Capital ('000) Treasury Shares Capital Reserve ($'000) Dividend Reserve (S'000) Total Equity ($'000) Notes ($ 000) YEAR ENDED 30 SEPTEMBER 2019 Balance at 1 October 2018 851,941 (267) (1,099) 741,673 72,624 4,268 43.444 1,712,584 (14,685) (14,685) (14,685) (14,685) 60,643 60,643 60,643 (14,685) 45,958 Comprehensive income Fair value changes on equity investments measured at fair value through other comprehensive income Other comprehensive income for the year Profit for the year Total comprehensive income for the year Contributions by and distributions to owners Employee share-based expense Issue of shares in the Company upon vesting of shares awarded Treasury shares reissued pursuant to share plans Dividends: Dividends paid Dividends proposed Total transactions with owners in their capacity as owners Balance at 30 September 2019 1,568 1,568 11 1,608 (1,608) 11 267 8 (275) 9 (65,206) (21,762) (57,961) (43,444) 57,961 1,608 267 8 (1,091) (79,723) 722,593 (315) 3,953 14,517 57,961 (63,638) 1,694,904 853,549 57,939 YEAR ENDED 30 SEPTEMBER 2018 Balance at 1 October 2017 849,301 (267) (1,099) 734,205 83,813 4,589 43,408 1,713,950 (11,189) (11,189) (11,189) (11,189) 72,669 72.669 72.669 (11,189) 61,480 Comprehensive income Fair value changes on available-for-sale financial assets Other comprehensive income for the year Profit for the year Total comprehensive income for the year Contributions by and distributions to owners Employee share-based expense Issue of shares in the Company upon vesting of shares awarded Dividends: Dividends paid Dividends proposed Total transactions with owners in their capacity as owners Balance at 30 September 2018 2,319 2,319 2,640 (2,640) 11 9 (65,165) (21,757) (43,444) (43,408) 43,444 2,640 851,941 (65,201) 741,673 (321) 4,268 36 43,444 (62,846) 1,712,584 (267) (1,099) 72,624 Cash Flow Statement for the year ended 30 September 2019 THE GROUP 2019 2018 ($'000) ($'000) (restated) 267,458 199,727 45,918 12,090 118 (804) 1,000 1,652 (3,271) (14,628) 30,491 3,568 (97,697) CASH FLOWS FROM OPERATING ACTIVITIES Profit before taxation and exceptional items Adjustments for: Depreciation of fixed assets Amortisation of brands and intangible assets Impairment of fixed assets and intangible assets Reversal of impairment of fixed assets Fixed assets written off Provision for employee benefits Write back of provision for employee benefits Gain on disposal of fixed assets and intangible assets Interest income Interest expenses Share of results of joint venture companies Share of results of associated companies Gross income from investments Employee share-based expense Fair value adjustment of investment properties Fair value adjustment of financial instruments Gain on disposal of financial instruments Operating cash before working capital changes Change in inventories Change in receivables Change in related parties' and joint venture and associated companies' balances Change in payables Currency realignment Cash generated from operations Interest income received Interest expenses paid Income taxes paid Payment of employee benefits Net cash from operating activities 49,407 11,299 209 (355) 1,272 2,527 (70) (11,633) (6,968) 21,663 445 (113,941) (470) 2,213 1,370 135 (22) 224,539 (18,114) (1,927) 469 45,213 7,978 258,158 5,399 (21,543) (28,903) (2,476) 210,635 4,431 (301) 173 (804) 181,663 7,504 4,734 (6,904) (3,504) 5,489 188,982 12,737 (30,265) (11,289) (1,216) 158,949 87,146 4,871 CASH FLOWS FROM INVESTING ACTIVITIES Dividends from associated companies Gross income from investments Proceeds from disposal of fixed assets and intangible assets Proceeds from disposal of investment property Net cash (outflow)/inflow on acquisition of subsidiary companies and business assets Investments in joint venture companies Investments in an associated company Purchase of other investment Purchase of fixed assets Payment for intangible assets Net cash used in investing activities 93,695 470 15,110 12,948 (22,638) (115,309) 687 (158,996) (17,068) (191,788) (213,182) (10,969) (93,187) (13,369) (238,003) Cash Flow Statement for the year ended 30 September 2019 THE GROUP 2019 2018 ($'000) ($'000) (restated) CASH FLOWS FROM FINANCING ACTIVITIES Proceeds from term loans and bank borrowings Repayment of term loans and bank borrowings Purchase of shares by a subsidiary company Capital contribution by non-controlling interests Payment of dividends: by subsidiary companies to non-controlling interests by the Company to shareholders Net cash used in financing activities 442,962 (488,754) (1,658) 15,082 50,759 (485,617) (938) 102 (30,954) (65,206) (128,528) (31,000) (65,165) (531,859) Net decrease in cash and cash equivalents Cash and cash equivalents at beginning of year Effects of exchange rate changes on cash and cash equivalents Cash and cash equivalents at end of year (109,681) 527,166 (158) 417,327 (610,913) 1,134,383 3,696 527,166 Cash and cash equivalents at end of year comprise: Cash and bank deposits (Note 21) Less: Deposits pledged in relation to acquisition of subsidiary companies (Note 21) 420,333 (3,006) 417,327 530,125 (2,959) 527,166 Analysis of acquisition of subsidiary companies and business assets 7,135 892 7,290 Net assets acquired: Intangible assets Other non-current assets Current assets Borrowings Other current liabilities Other non-current liabilities Non-controlling interests Cash and cash equivalents (8,788) 1,781 8,643 (219) (2,541) (119) (4,073) 2,637 6,109 19,666 25,775 (500) 1,585 8,114 784 8,898 Provisional goodwill/goodwill on acquisition Consideration paid Deferred consideration Less: Deposits paid in previous financial year Cash and cash equivalents of subsidiary companies and business assets acquired Net cash outflow/(inflow) on acquisition of subsidiary companies and business assets (2,637) 22,638 (8,000) (1,585) (687) DIRECTORS' REPORT for the financial year ended 31 December 2019 The Directors hereby submit their report and the audited financial statements of the Company for the financial year ended 31 December 2019. DIRECTORS The Directors in office during the financial year and during the period from the end of the financial year to the date of the report are: Dato' Zainal Abidin bin Putih Saw Chooi Lee Bernardus Hermannus Maria Kodden Tarang Gupta Dato' Dr Rosini Alias Tengku Nurul Azian Tengku Shahriman Boey Tak Kong Jurgen Sandmann Datin Seri Sunita Mei-Lin Rajakumar Jean Serge Krol (Retired on 26 April 2019) (Resigned 19 July 2019) (Appointed 27 February 2019) (Appointed 19 July 2019) In accordance with Article 93(a) of the Company's Constitution, Ms. Saw Chooi Lee, Mr. Bernardus Hermannus and Mr. Tarang Gupta shall retire by rotation at the forthcoming Annual General Meeting of the Company and being eligible, offer themselves for re-election. In accordance with Article 96 of the Company's Constitution, Tengku Nurul Azian binti Tengku Shahriman, Datin Seri Sunita Mei-Lin Rajakumar and Mr. Jean Serge Krol who were appointed since the date of the last report, shall retire at the forthcoming Annual General Meeting of the Company and being eligible, offer themselves for re-election. Dato' Zainal Abidin bin Putih has served as an Independent Non-Executive Director of the Company for cumulative term of more than ten (10) years. The Board has assessed and concluded that Dato' Zainal Abidin bin Putih has fulfilled the criteria under the definition of an Independent Director as stated the Main Market Listing Requirements of Bursa Malaysia Securities Berhad, and thus he would be able to function as check and balance and brings with them an element of objectivity to the Board. As such, approval will be sought at the forthcoming Annual General Meeting of the Company for Dato' Zainal Abidin bin Putih, to continue to act as an Independent Non-Executive Director of the Company. PRINCIPAL ACTIVITIES The Company manufactures and distributes a wide range of dairy products, such as specialised powders for infant and growing up children, liquid milk in different packaging formats and yoghurts. The Company markets these products under various brand names such as Dutch Lady, Dutch Baby, Frisolac, Friso Gold and Dutch Lady PureFarm. There has been no significant change in the nature of these activities during the financial year. FINANCIAL RESULTS RM'000 Net profit for the year 102,958 RESERVES AND PROVISIONS There were no material transfers to or from reserves and provisions during the financial year under review except as disclosed in the financial statements. ISSUE OF SHARES AND DEBENTURES There were no changes in the authorised, issued and paid-up capital of the Company during the financial year. There were no debentures issued during the financial year. DIRECTORS' BENEFITS Since the end of the previous financial year, no Director has received or become entitled to receive a benefit (other than the benefits shown under Directors' Remuneration) by reason of a contract made by the Company or by a related corporation with the Director or with a firm of which the Director is a member, or with a company in which the Director has a substantial financial interest. Neither during nor at the end of the financial year was the Company a party to any arrangements whose object was to enable the Directors to acquire benefits by means of the acquisition of shares in, or debentures of the Company or any other body corporate. DIRECTORS' INTERESTS IN SHARES AND DEBENTURES According to the Register of Directors' Shareholdings required to be kept under Section 59 of the Companies Act 2016, none of the Directors who held office at the end of the financial year held any shares or debentures in the Company or its holding company or subsidiaries of the holding company during the financial year. Under the Company's Constitution, the Directors are not required to hold any shares in the Company. DIVIDENDS Since the end of the previous financial year, the Company paid: i) a first interim ordinary dividend of 50.00 sen per ordinary share, tax exempt under the single-tier tax system, totalling RM32,000,000 in respect of the financial year ended 31 December 2019 on 17 May 2019; and ii) a second interim ordinary dividend of 50.00 sen per ordinary share, tax exempt under the single-tier tax system, totalling RM32,000,000 in respect of the financial year ended 31 December 2019 on 24 December 2019. The Directors do not recommend any final dividend to be paid for the financial year ended 31 December 2019. DIRECTORS' REPORT for the financial year ended 31 December 2019 DIRECTORS' REMUNERATION Details of Directors' remuneration are set out in Note 15 to the financial statements. INSURANCE EFFECTED FOR DIRECTORS During the financial year, the total amount of insurance effected for Directors of the Company is RM7,563. HOLDING COMPANIES The immediate and ultimate holding companies are FrieslandCampina DLMI Malaysia Holding BV and Royal FrieslandCampina NV respectively. Both companies are incorporated in the Netherlands. OPTIONS GRANTED OVER UNISSUED SHARES No options were granted to any person to take up unissued shares of the Company during the financial year. OTHER STATUTORY INFORMATION (a) Before the financial statements of the Company were prepared, the Directors took reasonable steps: (i) to ascertain that proper action had been taken in relation to the writing off of bad debts and the making of provision for doubtful debts and satisfied themselves that all known bad debts had been written off and that adequate provision had been made for doubtful debts; and (ii) to ensure that any current assets, which were unlikely to be realised in the ordinary course of business including the values of current assets as shown in the accounting records of the Company had been written down to an amount which the current assets might be expected so to realise. (b) At the date of this report, the Directors are not aware of any circumstances: (i) which would render the amounts written off for bad debts or the amount of the provision for doubtful debts inadequate to any substantial extent; or (ii) which would render the values attributed to current assets in the financial statements of the Company misleading; or (iii) which have arisen which would render adherence to the existing method of valuation of assets or liabilities of the Company misleading or inappropriate. (C) At the date of this report: (1) there are no charges on the assets of the Company which have arisen since the end of the financial year which secures the liabilities of any other person; and (ii) there are no contingent liabilities in the Company which have arisen since the end of the financial year. OTHER STATUTORY INFORMATION (CONTINUED) (d) No contingent or other liability has become enforceable or is likely to become enforceable within the period of twelve months after the end of the financial year which, in the opinion of the Directors, will or may affect the ability of the Company to meet its obligations when they fall due. (e) At the date of this report, the Directors are not aware of any circumstances not otherwise dealt with in this report or the financial statements of the Company which would render any amount stated in the respective financial statements misleading. (f) In the opinion of the Directors: (1) the results of the operations of the Company during the financial year were not substantially affected by any item, transaction or event of a material and unusual nature; and (ii) there has not arisen in the interval between the end of the financial year and the date of this report any item, transaction or event of a material and unusual nature likely to affect substantially the results of the operations of the Company for the financial year in which this report is made. AUDITORS' REMUNERATION Details of auditors' remuneration are set out in Note 14 to the financial statements. AUDITORS The auditors, PricewaterhouseCoopers PLT (LLP0014401-LCA & AF 1146), have expressed their willingness to accept re-appointment as auditors. This report was approved by the Board of Directors on 25 February 2020. Signed on behalf of the Board of Directors: Tarang Gupta an Serge Krol Petaling Jaya 25 February 2020 STATEMENT OF FINANCIAL POSITION as at 31 December 2019 Note 2019 RM'000 2018 RM'000 3 122,297 Assets Property, plant and equipment Right-of-use assets Intangible assets 4 123,482 3,977 1,675 5 2,956 Total non-current assets 129,134 125,253 6 7 Inventories Trade and other receivables Prepayments Cash and bank balances Derivative financial assets 135,024 112,852 5,052 61,532 131,050 112,381 3,819 32,109 8 9 190 Total current assets 314,460 279,549 Total assets 443,594 404,802 Equity Share capital Retained earnings 10 64,000 64,000 41,459 80,417 Total equity 144,417 105,459 Liabilities Lease liabilities Deferred tax liabilities 4 340 11 6,794 6,539 Total non-current liabilities 7,134 6,539 12 264,928 207 13 Trade and other payables Provision Current tax liabilities Bank overdraft Lease liabilities Derivative financial liabilities 266,388 191 9,994 15,172 7,663 16,724 8 4 634 9 1,887 1,059 Total current liabilities 292,043 292,804 Total liabilities 299,177 299,343 Total equity and liabilities 443,594 404,802 STATEMENT OF PROFIT OR LOSS AND OTHER COMPREHENSIVE INCOME for the financial year ended 31 December 2019 Note 2019 RM'000 2018 RM'000 Revenue from contracts with customers - sales of goods recognised point in time Cost of sales 1,066,662 (661,942) 1,048,568 (632,317) Gross profit Other income Distribution expenses Administrative expenses 404,720 3,371 (168,191) (28,156) (70,902) 416,251 10,494 (162,522) (28,764) (61,594) Other expenses Results from operating activities Interest income Finance costs 140,842 455 173,865 858 (3,697) (3,431) 14 Profit before tax Tax expense 137,600 (34,642) 171,292 (41,843) 16 Net profit for the financial year/Total comprehensive income for the financial year 102,958 129,449 Basic and diluted earnings per ordinary share (sen) 17 160.9 202.3 STATEMENT OF CHANGES IN EQUITY for the financial year ended 31 December 2019 Note Share capital RM'000 Distributable Retained earnings RM'000 Total equity RM'000 64,000 At 1 January 2018 Net profit/Total comprehensive income for the financial year Dividends to owners of the Company 40,010 129,449 (128,000) 104,010 129,449 (128,000) 18 64,000 At 31 December 2018/1 January 2019 Net profit/Total comprehensive income for the financial year Dividends to owners of the Company 41,459 102,958 (64,000) 105,459 102,958 (64,000) 18 At 31 December 2019 64,000 80,417 144,417 Note 10 STATEMENT OF CASH FLOWS for the financial year ended 31 December 2019 Note 2019 RM'000 2018 RM'000 Cash flows from operating activities Cash receipts from customers and other receivables Cash paid to suppliers and employees 1,068,445 (913,940) 1,057,103 (896,760) Cash generated from operations Income tax paid 154,505 (36,718) 160,343 (39,893) Net cash from operating activities 117,787 120,450 Cash flows from investing activities Purchase of property, plant and equipment Purchase of intangible assets Proceeds from disposal of property, plant and equipment Interest received u w (19,846) (192) 73 (34,263) (15) 455 857 Net cash used in investing activities (19,510) (33,421) Cash flows from financing activities Interest paid Dividends paid Payment for principal portion of lease liabilities (3,640) (64,000) (2,766) (3,431) (128,000) 18 20 Net cash used in financing activities (70,406) (131,431) 27,871 Net increase/(decrease) in cash and cash equivalents Cash and cash equivalents at 1 January (44,402) 61,339 16,937 Cash and cash equivalents at 31 December 8 44,808 16,937 STATEMENT OF CASH FLOWS for the year ended 31 December 2019 The reconciliation of movement of liabilities to cash flows arising from financing activities are as follows: Lease Liabilities RM'000 Total RM'000 Balance at 1 January 2019 Effect on the adoption of MERS 16 3,683 3,683 Changes from financing cash flow Non-cash changes: Interest portion of lease payments 57 57 Cash flows: Repayment of lease liabilities (2,766) (2,766) Total changes from financing cash flow (2,766) (2,766) Balance at 31 December 2019 974 974 NOTE TO THE STATEMENT OF CASH FLOWS Interest paid shown in cash flows from financing activities arose from interest paid to a licensed financial institution to enable certain trade customers to pay goods invoiced through a corporate purchasing card issued by the financial institution. Fraser & Neave Holdings Bhd and Dutch Lady Milk Industries Berhad are among the companies listed on the main market of Bursa Malaysia under Consumer Products & Services sector. Fraser & Neave Holdings Bhd (F&NHB or the Group) is amongst the region's oldest and most established companies. Founded in 1883 to produce carbonated soft drinks by John Fraser and David Chalmers Neave - from whom the 'F&N initials are derived - the Group has grown to be an iconic household name that is trusted to provide 'Pure Enjoyment, Pure Goodness through its wide portfolio of well-loved brands. Dutch Lady Milk Industries Berhad (DLMI") is a leading established dairy company in Malaysia with over 50 years of presence backed by over 140 years of Dutch dairy heritage garnered from our ultimate holding company, Royal Friesland Campina N.V. ("RFC"), which is one of the world's largest dairy co-operatives. With this heritage, DLMI is constantly looking to further strengthen it
Step by Step Solution
There are 3 Steps involved in it
Step: 1

Get Instant Access to Expert-Tailored Solutions
See step-by-step solutions with expert insights and AI powered tools for academic success
Step: 2

Step: 3
Ace Your Homework with AI
Get the answers you need in no time with our AI-driven, step-by-step assistance
Get Started
Corporate Governance In Japan Institutional Change And Organizational Diversity
Authors: Masahiko Aoki , Gregory Jackson, Hideaki Miyajima
1st Edition
0199284520,0191536385