Question
The annual returns of three stocks for the past seven years are given in the following table: Year Stock X Stock Y Stock Z 2011
The annual returns of three stocks for the past seven years are given in the following table:
Year | Stock X | Stock Y | Stock Z |
2011 | 3.00% | 14.00% | 19.00% |
2012 | 9.00% | 7.00% | 11.00% |
2013 | 12.00% | 19.00% | 5.00% |
2014 | 19.00% | 13.00% | 12.00% |
2015 | 23.00% | -7.00% | 11.00% |
2016 | 5.00% | -3.00% | 7.00% |
2017 | 10.00% | 9.00% | 14.00% |
- Determine the average return and the standard deviation of returns for each stock. Which stock has the highest expected return and which one has the highest risk?
- Determine the correlation coefficient and the covariance between each pair of stocks.
Step by Step Solution
3.33 Rating (156 Votes )
There are 3 Steps involved in it
Step: 1

Get Instant Access to Expert-Tailored Solutions
See step-by-step solutions with expert insights and AI powered tools for academic success
Step: 2

Step: 3

Ace Your Homework with AI
Get the answers you need in no time with our AI-driven, step-by-step assistance
Get StartedRecommended Textbook for
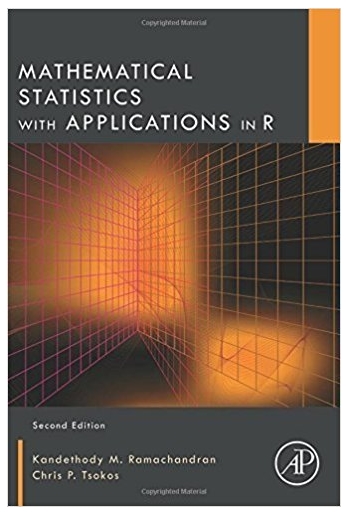
Mathematical Statistics With Applications In R
Authors: Chris P. Tsokos, K.M. Ramachandran
2nd Edition
124171133, 978-0124171138
Students also viewed these Mathematics questions
Question
Answered: 1 week ago
Question
Answered: 1 week ago
Question
Answered: 1 week ago
Question
Answered: 1 week ago
Question
Answered: 1 week ago
Question
Answered: 1 week ago
Question
Answered: 1 week ago
Question
Answered: 1 week ago
Question
Answered: 1 week ago
Question
Answered: 1 week ago
Question
Answered: 1 week ago
Question
Answered: 1 week ago
Question
Answered: 1 week ago
Question
Answered: 1 week ago
Question
Answered: 1 week ago
Question
Answered: 1 week ago
Question
Answered: 1 week ago
Question
Answered: 1 week ago
Question
Answered: 1 week ago
Question
Answered: 1 week ago
Question
Answered: 1 week ago
Question
Answered: 1 week ago
View Answer in SolutionInn App


