Answered step by step
Verified Expert Solution
Question
1 Approved Answer
The annual revenue of Amazon.com, in billion $, is shown below. Year 2007 2008 19.160 Revenue (billion $) Year Revenue (billion $) Year Revenue

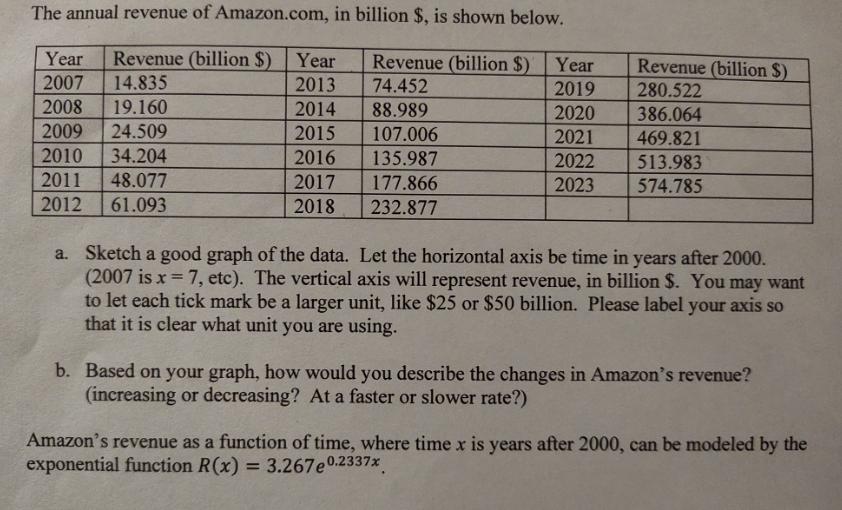
The annual revenue of Amazon.com, in billion $, is shown below. Year 2007 2008 19.160 Revenue (billion $) Year Revenue (billion $) Year Revenue (billion $) 14.835 2013 74.452 2019 280.522 2014 88.989 2020 386.064 2009 24.509 2015 107.006 2021 469.821 2010 34.204 2016 135.987 2022 513.983 2011 48.077 2017 177.866 2023 574.785 2012 61.093 2018 232.877 a. Sketch a good graph of the data. Let the horizontal axis be time in years after 2000. (2007 is x=7, etc). The vertical axis will represent revenue, in billion $. You may want to let each tick mark be a larger unit, like $25 or $50 billion. Please label your axis so that it is clear what unit you are using. b. Based on your graph, how would you describe the changes in Amazon's revenue? (increasing or decreasing? At a faster or slower rate?) Amazon's revenue as a function of time, where time x is years after 2000, can be modeled by the exponential function R(x) = 3.267e0.2337x
Step by Step Solution
There are 3 Steps involved in it
Step: 1

Get Instant Access to Expert-Tailored Solutions
See step-by-step solutions with expert insights and AI powered tools for academic success
Step: 2

Step: 3

Ace Your Homework with AI
Get the answers you need in no time with our AI-driven, step-by-step assistance
Get Started


