the answer like this
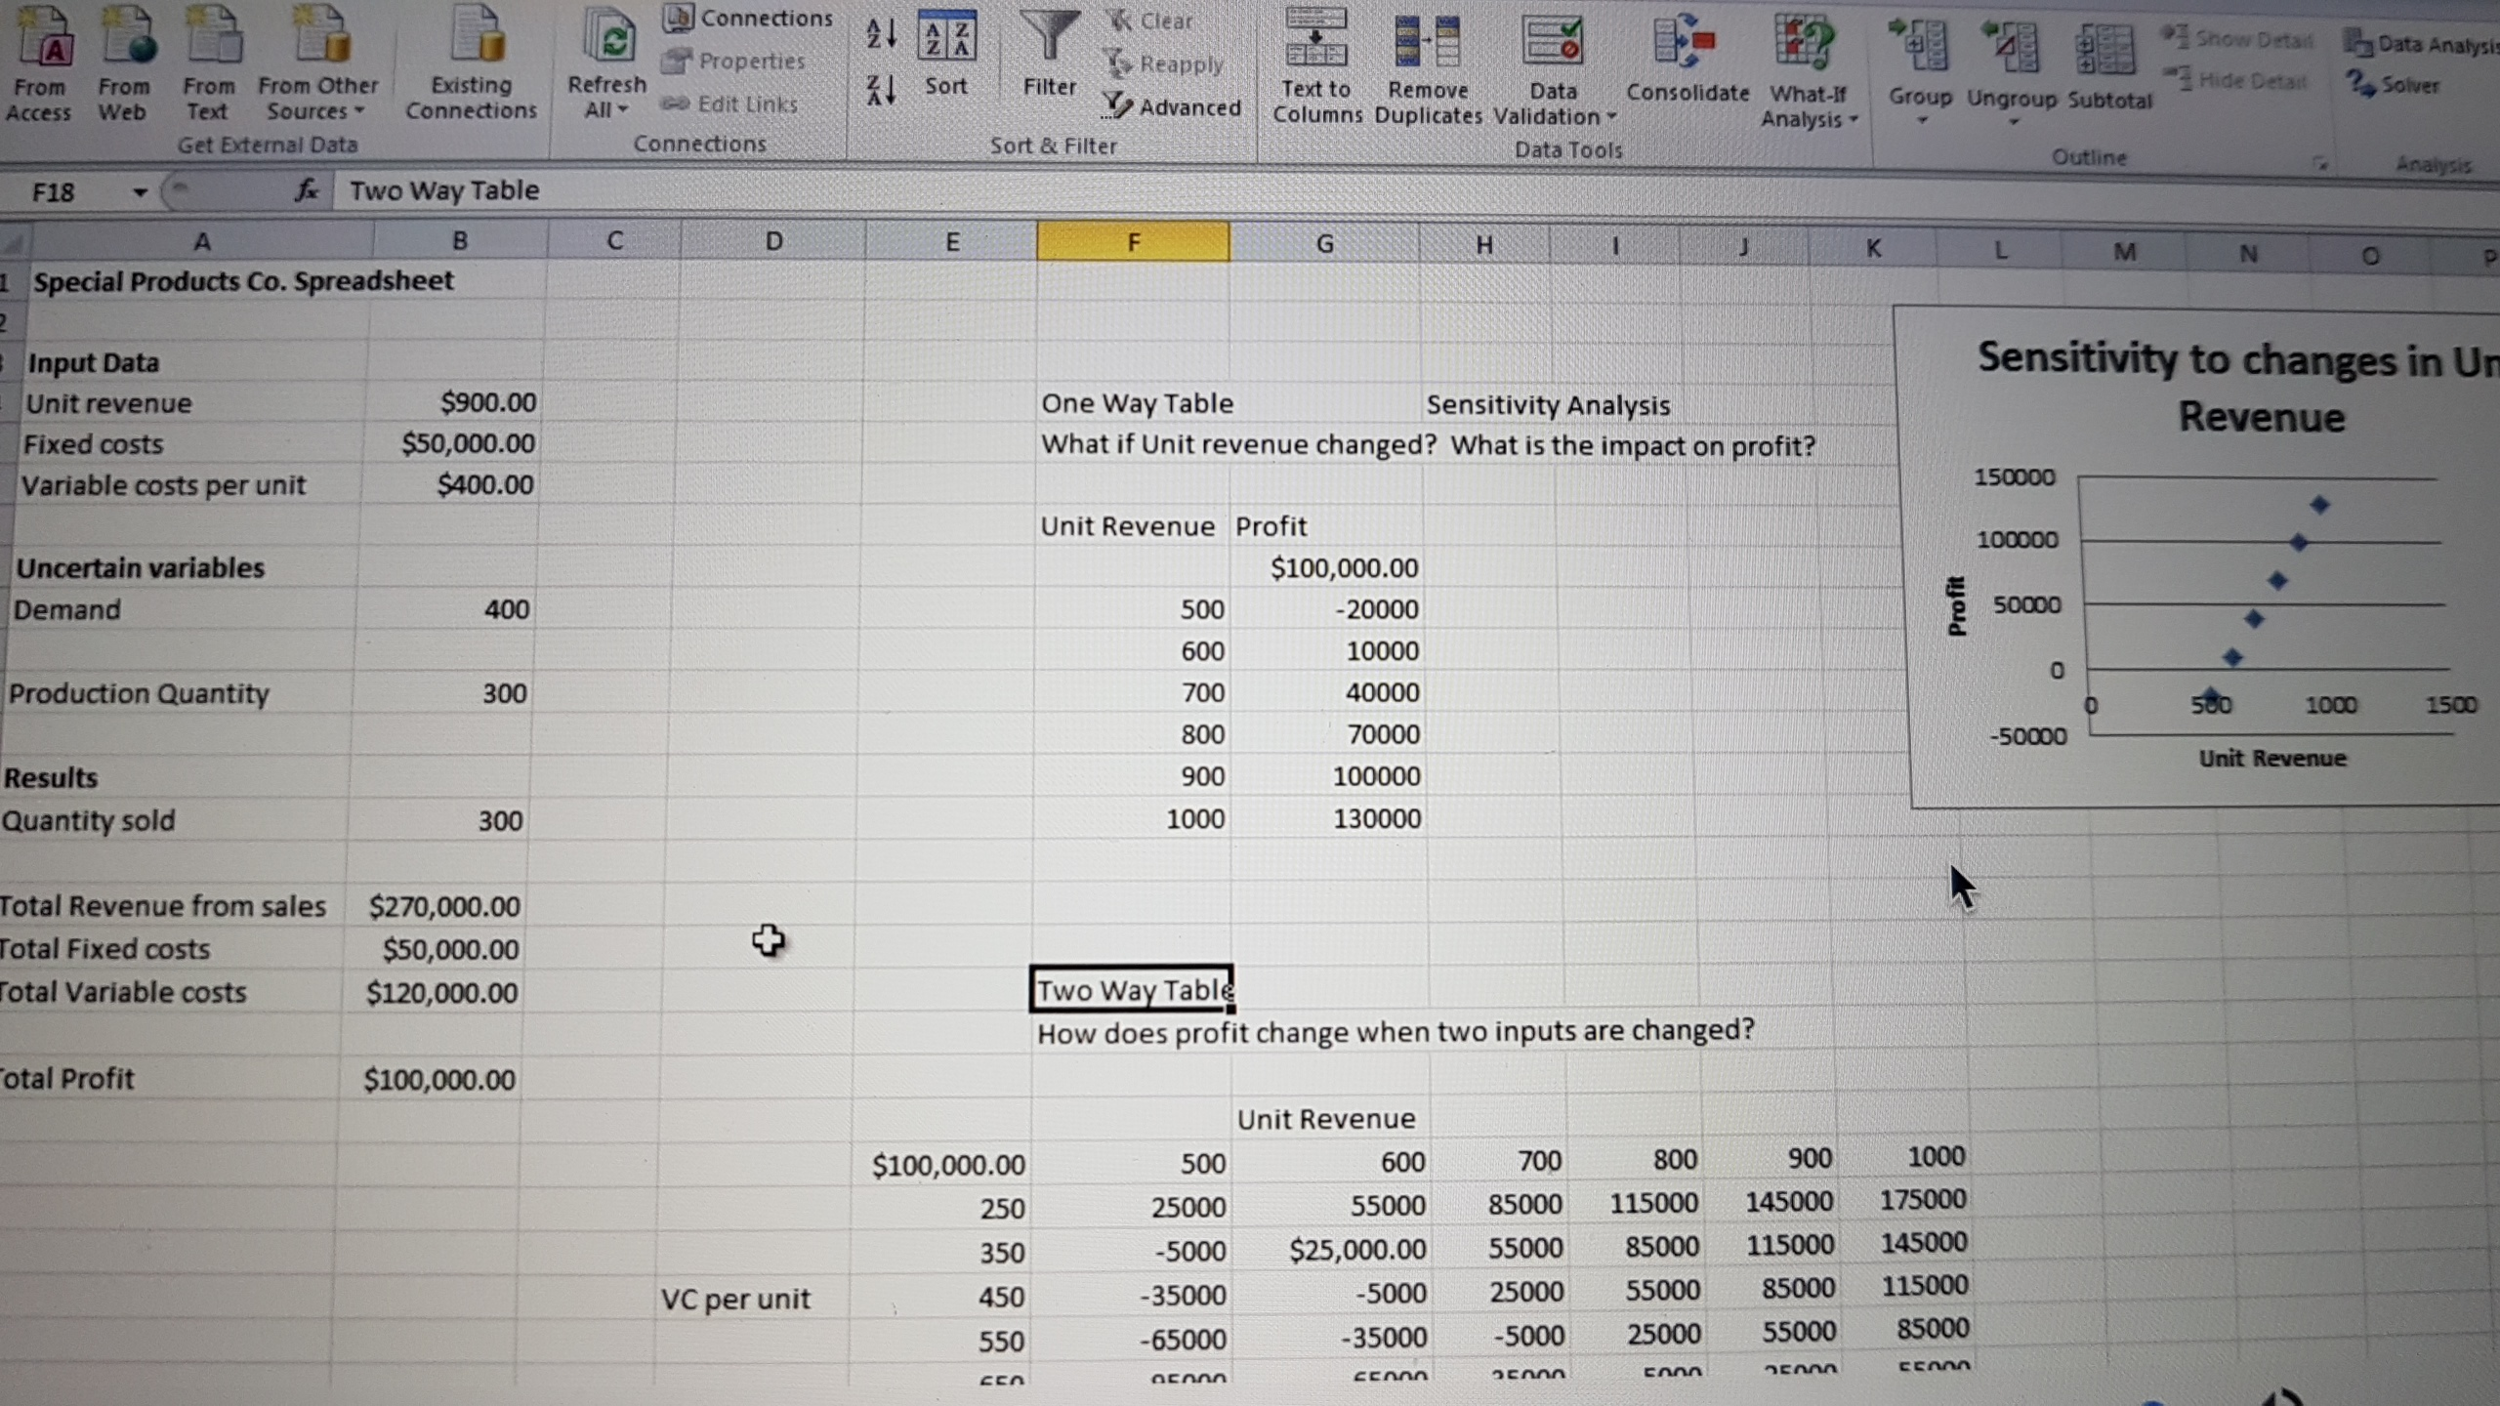
The manager for a fast-food restaurant featuring hamburgers is adding salads to the menu. For each of the two new options, the price to the customer will be $7.50 per salad. The Make option is to install a salad bar' stocked with vegetables, fruits, and toppings and let the customer assemble the salad. The salad bar would have to be leased and a part-time employee hired. The manager estimates the fixed costs at $12,000 and variable costs totaling $2.50 per salad. The Buy option is to have preassembled salads available for sale. They would be purchased from a local supplier at $4.50 per salad. Offering preassembled salads would require installation and operation of additional refrigeration, with an annual fixed cost of $3,000. Set up spreadsheet models to calculate total profit. Construct your models as demonstrated in the notes and podcasts. A separate model must be created for each option. Production quantity is the decision variable - assume that every salad that is made or purchased will be sold. Use your models to answer the questions below (do separately for Make & Buy). Use the Goal Seek function in Excel to determine the break-even quantity. Create a one-way table, using Excel's Data/What-If/Data Table tool, to demonstrate the sensitivity of profit to changes in selling price per salad. Use prices of 5.00, 6.00, 7.00 and 8.00 in your tables. Create a graph of the sensitivity results from part ii. (scatterplot) With selling price of $8.00 and a volume of 2, 500 salads, winch option would be preferred. Graph the total profit lines for both options on one graph showing how their profits change over a quantity range from 0 to 10,000 units. Set price back to $7.50 per unit for each option for this graph. (This graph will be similar to the cost vs revenue graph that is shown in chapter 1 and demonstrated in one of the podcasts, but the two lines here will be profit lines) The manager for a fast-food restaurant featuring hamburgers is adding salads to the menu. For each of the two new options, the price to the customer will be $7.50 per salad. The Make option is to install a salad bar' stocked with vegetables, fruits, and toppings and let the customer assemble the salad. The salad bar would have to be leased and a part-time employee hired. The manager estimates the fixed costs at $12,000 and variable costs totaling $2.50 per salad. The Buy option is to have preassembled salads available for sale. They would be purchased from a local supplier at $4.50 per salad. Offering preassembled salads would require installation and operation of additional refrigeration, with an annual fixed cost of $3,000. Set up spreadsheet models to calculate total profit. Construct your models as demonstrated in the notes and podcasts. A separate model must be created for each option. Production quantity is the decision variable - assume that every salad that is made or purchased will be sold. Use your models to answer the questions below (do separately for Make & Buy). Use the Goal Seek function in Excel to determine the break-even quantity. Create a one-way table, using Excel's Data/What-If/Data Table tool, to demonstrate the sensitivity of profit to changes in selling price per salad. Use prices of 5.00, 6.00, 7.00 and 8.00 in your tables. Create a graph of the sensitivity results from part ii. (scatterplot) With selling price of $8.00 and a volume of 2, 500 salads, winch option would be preferred. Graph the total profit lines for both options on one graph showing how their profits change over a quantity range from 0 to 10,000 units. Set price back to $7.50 per unit for each option for this graph. (This graph will be similar to the cost vs revenue graph that is shown in chapter 1 and demonstrated in one of the podcasts, but the two lines here will be profit lines)