

Question
The area to the left of the Z value is: 0.1587 The area to the right of the Z value is: 0.8413 (1) Sexual assault
The area to the left of the Z value is: 0.1587
The area to the right of the Z value is: 0.8413
(1)
Sexual assault in college:In a Washington Post/Kaiser Family Foundation Poll conducted from January through March 2015, 20% of women (ages 17?26) who attended college during the past 4 years say they were sexually assaulted. The poll surveyed 514 randomly selected females.
What is the 90% confidence interval for the proportion of women (ages 17?26) who attended collegeduring the past 4 years and say they were sexually assaulted?
Group of answer choices
(0.182, 0.218)
(0.165, 0.235)
(0.155, 0.245)
(0.171, 0.229).
(2)
The administration at a community college wants to estimate the number ofparking spaces they will need next year. They survey 80 students; 75 of the students in the sampledrive to campus by themselves each day.
Which of the following is a reason the administration should not calculate a confidence interval forthe proportion of all students who drive to campus?Check all that apply.
Group of answer choices
The sample needs to be random but we don't know if it is.
The actual count of drivers is too small.
The actual count of those who do not drive to campus is too small.
n(p?hat) is not greater than 10.
n(1 minus p?hat) is not greater than 10.
(3)
Parking survey:For a class assignment, a group of statistics students set upa table near the student parking lot. They asked students who passed by to complete a quick surveyabout whether they support the building of a multi-level parking structure that would add 425 newspaces at the college.
They used the information from the survey to calculate the 95% confidenceinterval: (0.53, 0.72). To which population does the confidence interval apply?
Group of answer choices
They apply to all students at the college.
The results do not apply to any population because this was a convenience sample.
They apply only to the population of those who use the student parking lot.
They apply only to the population of those students who drive to the college.
(4)
In a study of the nicotine patch, 21% of those who used the patch for 2 monthsreported no smoking incidents in the following year. The 95% confidence interval is (17.4%, 24.8%).
Which of the following is an appropriate interpretation of the 95% confidence interval?
Group of answer choices
There is a 95% probability that the proportion of all nicotine patch users who would report no smoking incidents in the following year is between 17.4% and 24.8%.
We can be 95% confident that the proportion of all nicotine patch users who would report no smoking incidents in the following year is between 17.4% and 24.8%.
We can be 95% confident that the proportion of the sample who would report no smoking incidents in the following year is between 17.4% and 24.8%.
95% of samples will have between 17.4% and 24.8% who would report no smoking incidents in the following year.
(5)
In a survey conducted by the Pew Research Center in 2010 41% of Americans support the legalization of marijuana in the U.S. The researchers note that the margin of error is 3% using 95% confidence.
What does this margin of error tell you about the results of the survey?
Group of answer choices
We are 95% confident that the results are off by 3%.
3% of the respondents gave a fake answer.
We can be 95% confident that the proportion of all Americans who support legalization of marijuana is within 3% of 41%.
We are certain that the proportion of all Americans who support legalization of marijuana is between 38% and 44%.
(6?
Sample size:A researcher is trying to decide how many people to survey. Which of the following sample sizes will result in a confidence interval with the largest width?
Group of answer choices
300
700
1000
The width depends on the sample proportion.
(7)
One population proportion test:Which of the following situationsinvolves testing a claim about a single population proportion?
Group of answer choices
The Centers for Disease Control estimates that 22.8% of Americans (ages 18 to 24) get 6 or less hours of sleep per night. A researcher believes that the figure for college students is higher than this.
The mean SAT math score for Florida is 514. An educational researcher is concerned that this average may be lower in rural counties.
A Statistics student wants to determine whether there is a difference in the average number of credit hours male and female students are taking.
A growing practice among some parents is called "redshirting," Redshirting means holding a child back a year from starting kindergarten even though he or she is eligible by age. Many states use August 31 as the cutoff for the 5th birthday in order for a child to start kindergarten. A researcher is curious if the proportion of boys with August birthdays who are redshirted is different than the proportion of girls with August birthdays who are redshirted.
(8)
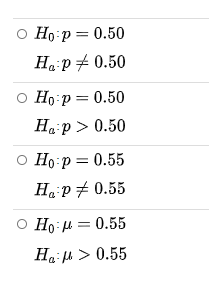
Researchers conducted a study to determine whether the majority of community college students plan to vote in the next presidential election. They surveyed 650 randomly selected community college students and found that 55% of them plan to vote.
Which of the following are the appropriate null and alternative hypotheses for this research question?
Step by Step Solution
There are 3 Steps involved in it
Step: 1

Get Instant Access to Expert-Tailored Solutions
See step-by-step solutions with expert insights and AI powered tools for academic success
Step: 2

Step: 3
Ace Your Homework with AI
Get the answers you need in no time with our AI-driven, step-by-step assistance
Get Started
College Algebra
Authors: Margaret L. Lial, John Hornsby, David I. Schneider, Callie Daniels
12th edition
134697022, 9780134313795 , 978-0134697024