Question
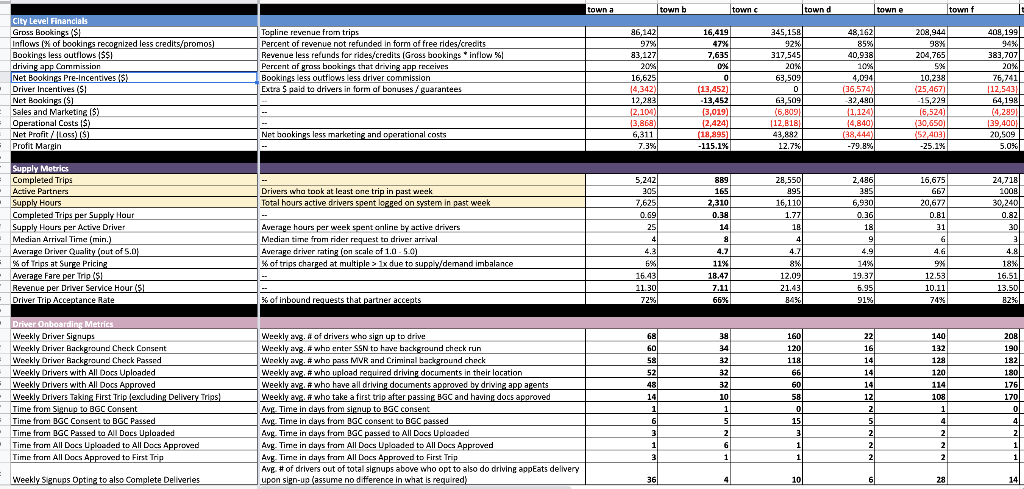
The attached data set gives a selection of metrics for the Driving app business in hypothetical cities. Take the information in this data set to
The attached data set gives a selection of metrics for the Driving app business in hypothetical cities. Take the information in this data set to develop a model that gives a city health score for the cities shown. You should arrive at a numerical score for each city that shows which city is currently the "healthiest" down to which city is the "least healthy."
1) Which city is the most supply-constrained (driver-constrained) and why? Which city is the most demand-constrained (rider-constrained) and why? 2) Which city has the healthiest driver onboarding? What patterns do you see for conversion of drivers from one stage of onboarding to the next, the time it takes, etc.? 3) Based on your model, which city has the lowest city health score? What are the main problems in this city and how could you solve them? 4) Choose ONE specific idea for improving city health in the lowest rated city (from question above). What metrics would you expect to improve and how would you measure success?
Step by Step Solution
There are 3 Steps involved in it
Step: 1

Get Instant Access to Expert-Tailored Solutions
See step-by-step solutions with expert insights and AI powered tools for academic success
Step: 2

Step: 3

Ace Your Homework with AI
Get the answers you need in no time with our AI-driven, step-by-step assistance
Get Started


