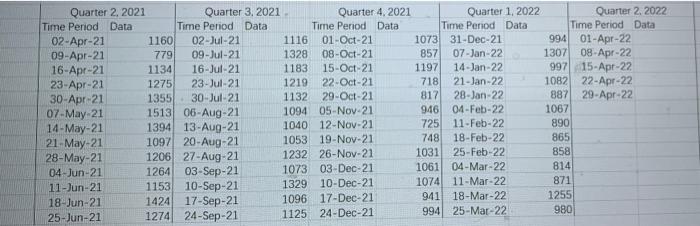
The attached Excel spreadsheet contains time-series data capturing the weekly average of crude oil imports of a small country in thousands of barrels per day. Your task is to use this historical data to project the import into week 53 and beyond. a) Create a time-series plot showing the week-to-week variation in oil imports. Comment on the patterns you observe in the plot. (2 marks) b) Use the following forecasting techniques to forecast the demand for week 53. (10 marks) a. 1-period moving average (nave forecast) 3-period moving average b. c. 3-period weighted moving average with 3-point weights - 0.3, 0.3, 0.4 (with 0.4 is given to the most recent period) d. Trend projection with linear regression c) Calculate MAD, MSE, and MAPE for each of the forecasting techniques used in part b. Begin your error calculation starting from week 5. Which model has the best performance on the historical data? (13 marks) Quarter 2, 2021 Time Period Data 02-Apr-21 09-Apr-21 16-Apr-21 23-Apr-21 30-Apr-21 07-May-21 14-May-21 21-May-21 28-May-21 04-Jun-21 11-Jun-21; 18-Jun-211 25-Jun-21 Quarter 3, 2021. Time Period Data 1160 02-Jul-21 09-Jul-21 779 1134 1275 16-Jul-21 23-Jul-21 1355 30-Jul-21 1513 06-Aug-21 1394 13-Aug-21 1097 20-Aug-21 1206 27-Aug-21 1264 03-Sep-21 10-Sep-21 17-Sep-21 1153 1424 1274 24-Sep-21 Quarter 4, 2021 Time Period Data 01-Oct-21 08-Oct-21 1116 1328 1183 15-Oct-21 1219 22-Oct-21 1132 29-Oct-21 1094 05-Nov-21 1040 12-Nov-21 1053 19-Nov-21 1232 26-Nov-21 1073 03-Dec-21 10-Dec-21 1329 1096 17-Dec-211 1125 24-Dec-21 Quarter 1, 2022 Time Period Data 31-Dec-21 1073 857 07-Jan-22 1197 14-Jan-22 718 21-Jan-22 817 28-Jan-22 946 04-Feb-22 725 11-Feb-22 748 18-Feb-22 1031 25-Feb-22 1061 04-Mar-22 1074 11-Mar-22 941 18-Mar-22 994 25-Mar-22 Quarter 2, 2022 Time Period Data 994 01-Apr-22 1307 08-Apr-22 997 15-Apr-22 1082 22-Apr-22 887 29-Apr-22 1067 890 865 858 814 871 1255 980 The attached Excel spreadsheet contains time-series data capturing the weekly average of crude oil imports of a small country in thousands of barrels per day. Your task is to use this historical data to project the import into week 53 and beyond. a) Create a time-series plot showing the week-to-week variation in oil imports. Comment on the patterns you observe in the plot. (2 marks) b) Use the following forecasting techniques to forecast the demand for week 53. (10 marks) a. 1-period moving average (nave forecast) 3-period moving average b. c. 3-period weighted moving average with 3-point weights - 0.3, 0.3, 0.4 (with 0.4 is given to the most recent period) d. Trend projection with linear regression c) Calculate MAD, MSE, and MAPE for each of the forecasting techniques used in part b. Begin your error calculation starting from week 5. Which model has the best performance on the historical data? (13 marks) Quarter 2, 2021 Time Period Data 02-Apr-21 09-Apr-21 16-Apr-21 23-Apr-21 30-Apr-21 07-May-21 14-May-21 21-May-21 28-May-21 04-Jun-21 11-Jun-21; 18-Jun-211 25-Jun-21 Quarter 3, 2021. Time Period Data 1160 02-Jul-21 09-Jul-21 779 1134 1275 16-Jul-21 23-Jul-21 1355 30-Jul-21 1513 06-Aug-21 1394 13-Aug-21 1097 20-Aug-21 1206 27-Aug-21 1264 03-Sep-21 10-Sep-21 17-Sep-21 1153 1424 1274 24-Sep-21 Quarter 4, 2021 Time Period Data 01-Oct-21 08-Oct-21 1116 1328 1183 15-Oct-21 1219 22-Oct-21 1132 29-Oct-21 1094 05-Nov-21 1040 12-Nov-21 1053 19-Nov-21 1232 26-Nov-21 1073 03-Dec-21 10-Dec-21 1329 1096 17-Dec-211 1125 24-Dec-21 Quarter 1, 2022 Time Period Data 31-Dec-21 1073 857 07-Jan-22 1197 14-Jan-22 718 21-Jan-22 817 28-Jan-22 946 04-Feb-22 725 11-Feb-22 748 18-Feb-22 1031 25-Feb-22 1061 04-Mar-22 1074 11-Mar-22 941 18-Mar-22 994 25-Mar-22 Quarter 2, 2022 Time Period Data 994 01-Apr-22 1307 08-Apr-22 997 15-Apr-22 1082 22-Apr-22 887 29-Apr-22 1067 890 865 858 814 871 1255 980