Answered step by step
Verified Expert Solution
Question
1 Approved Answer
7. The attached file, data_red_banjo_pints_sold.xlsx, lists the daily sales of IPA beer, in pints, for the first three years of operations of Red Banjo


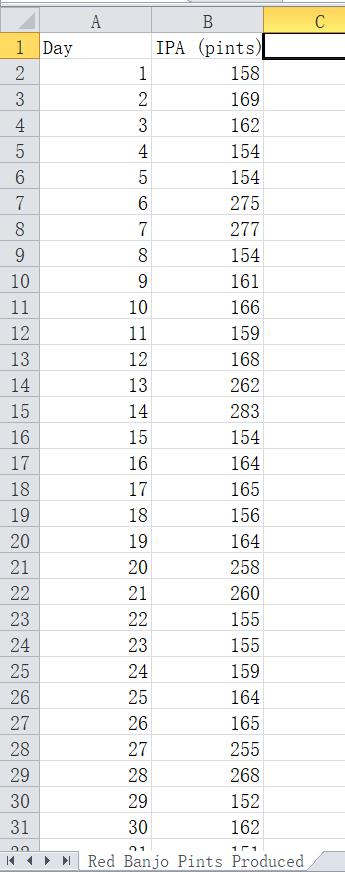
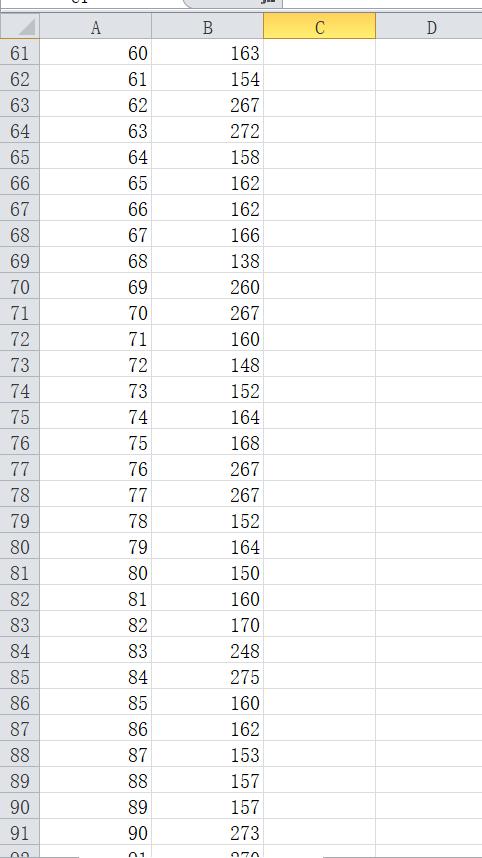
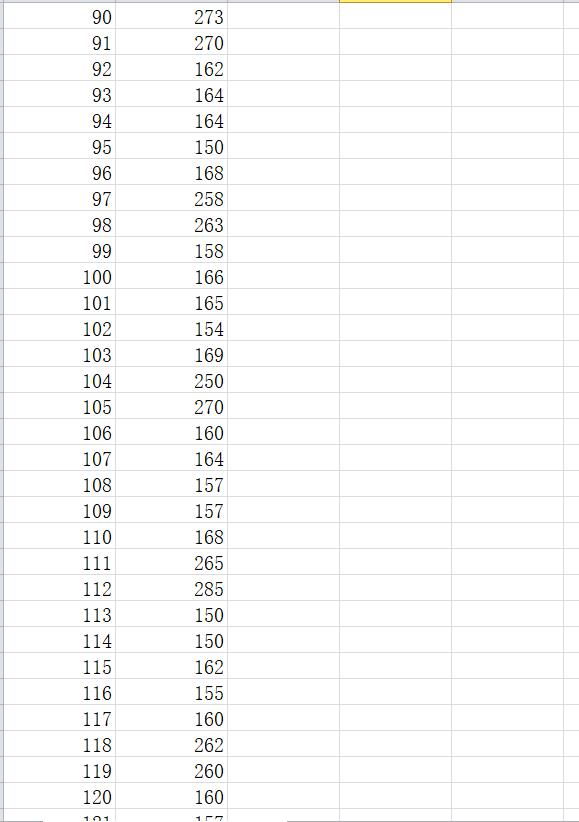
7. The attached file, data_red_banjo_pints_sold.xlsx, lists the daily sales of IPA beer, in pints, for the first three years of operations of Red Banjo Brewing Company. Construct a histogram with lower bin limit of 0 and bin width 50 for the variable IPA beer (pints). Which of the following best describes the sales data? symmetric negatively skewed positively skewed flat A 1 Day B IPA (pints) 2 1 158 3 2 169 4 3 162 5 6 7 456 4 154 154 275 8 7 277 9 8 154 10 9 161 11 10 166 12 11 159 13 12 168 14 13 262 15 14 283 16 15 154 17 16 164. 18 17 165 19 18 156 20 19 164 21 20 258 22 21 260 23 22 155 24 23 155 25 24. 159 26 25 164 27 26 165 28 27 255 29 28 268 30 29 152 31 30 162 20 01 11 K Red Banjo Pints Produced C A B C D 61 60 60 163 62 61 154. 63 62 267 64 63 272 65 64 158 66 65 162 67 66 162 68 67 166 69 68 138 70 69 260 71 70 267 72 71 160 73 72 148 74 73 152 75 74 164 76 75 168 77 76 267 78 77 267 79 78 152 80 79 164 81 80 150 82 81 160 83 82 170 84 83 248 85 84 275 86 85 160 87 86 162 88 87 153 89 88 157 90 89 157 91 90 273 00 01 070 90 273 91 270 92 162 93 164 94 164 95 150 96 168 97 258 98 263 99 158 100 166 101 165 102 154 103 169 104 250 105 270 106 160 107 164 108 157 109 157 110 168 111 265 112 285 113 150 114 150 115 162 116 155 117 160 118 262 119 260 120 160 101 157
Step by Step Solution
There are 3 Steps involved in it
Step: 1
I see that youve uploaded multiple images containing data and a question about constructing a histogram with specific bin limits and bin widths Lets w...
Get Instant Access to Expert-Tailored Solutions
See step-by-step solutions with expert insights and AI powered tools for academic success
Step: 2

Step: 3

Ace Your Homework with AI
Get the answers you need in no time with our AI-driven, step-by-step assistance
Get Started


