

Question
The attached image is for data from the 50 states of the United States. The X-axis is the poverty rate in the state, and the
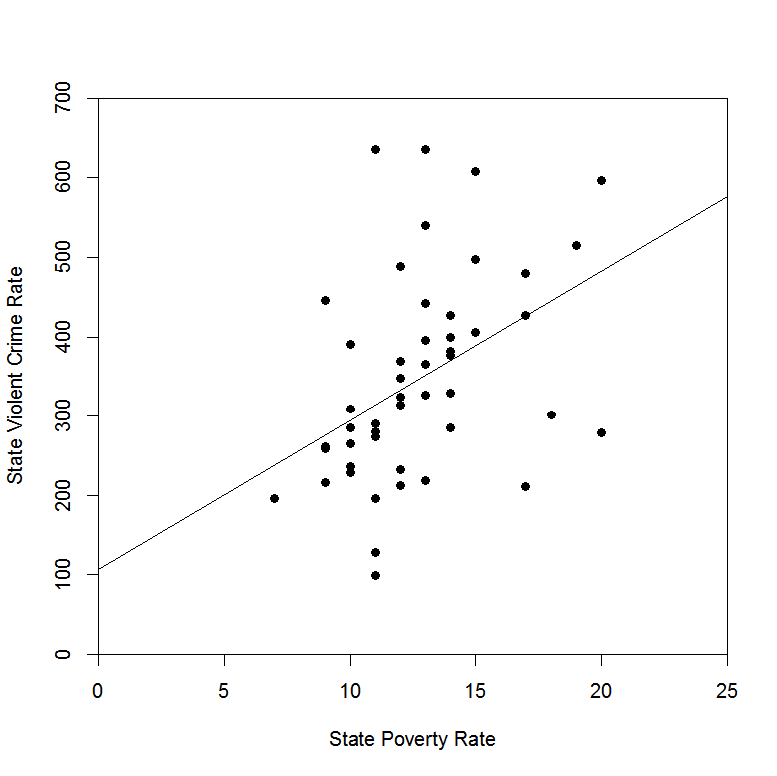
The attached image is for data from the 50 states of the United States. The X-axis is the poverty rate in the state, and the Y-axis is the violent crime rate in the state. The p-value is p=0.002 for a test of the null hypothesis that the slope of the line is zero, so we can reject the null hypothesis that the slope of the line is zero. EXPLAIN whether this information is sufficient to conclude (at the level of confidence typically used in political science) that a higher poverty rate in a state causes a higher violent crime rate.
The attached image is for data from the 50 states of the United States. The X-axis is the poverty rate in the state, and the Y-axis is the violent crime rate in the state. The p-value is p=0.002 for a test of the null hypothesis that the slope of the line is zero, so we can reject the null hypothesis that the slope of the line is zero. EXPLAIN whether this information is sufficient to conclude (at the level of confidence typically used in political science) that a higher poverty rate in a state causes a higher violent crime rate. |
State Violent Crime Rate 0 100 200 300 400 500 600 700 5 10 15 20 State Poverty Rate 25 25
Step by Step Solution
There are 3 Steps involved in it
Step: 1

Get Instant Access with AI-Powered Solutions
See step-by-step solutions with expert insights and AI powered tools for academic success
Step: 2

Step: 3
Ace Your Homework with AI
Get the answers you need in no time with our AI-driven, step-by-step assistance
Get Started
Auditing and Assurance Services An Applied Approach
Authors: Iris Stuart
1st edition
978-0073404004
