Answered step by step
Verified Expert Solution
Link Copied!

Question

1 Approved Answer

The attached picture contains all information. (b) The following table shows that marks distribution in a class of 65 students _ Numberofstudents i. Regroup the

The attached picture contains all information.
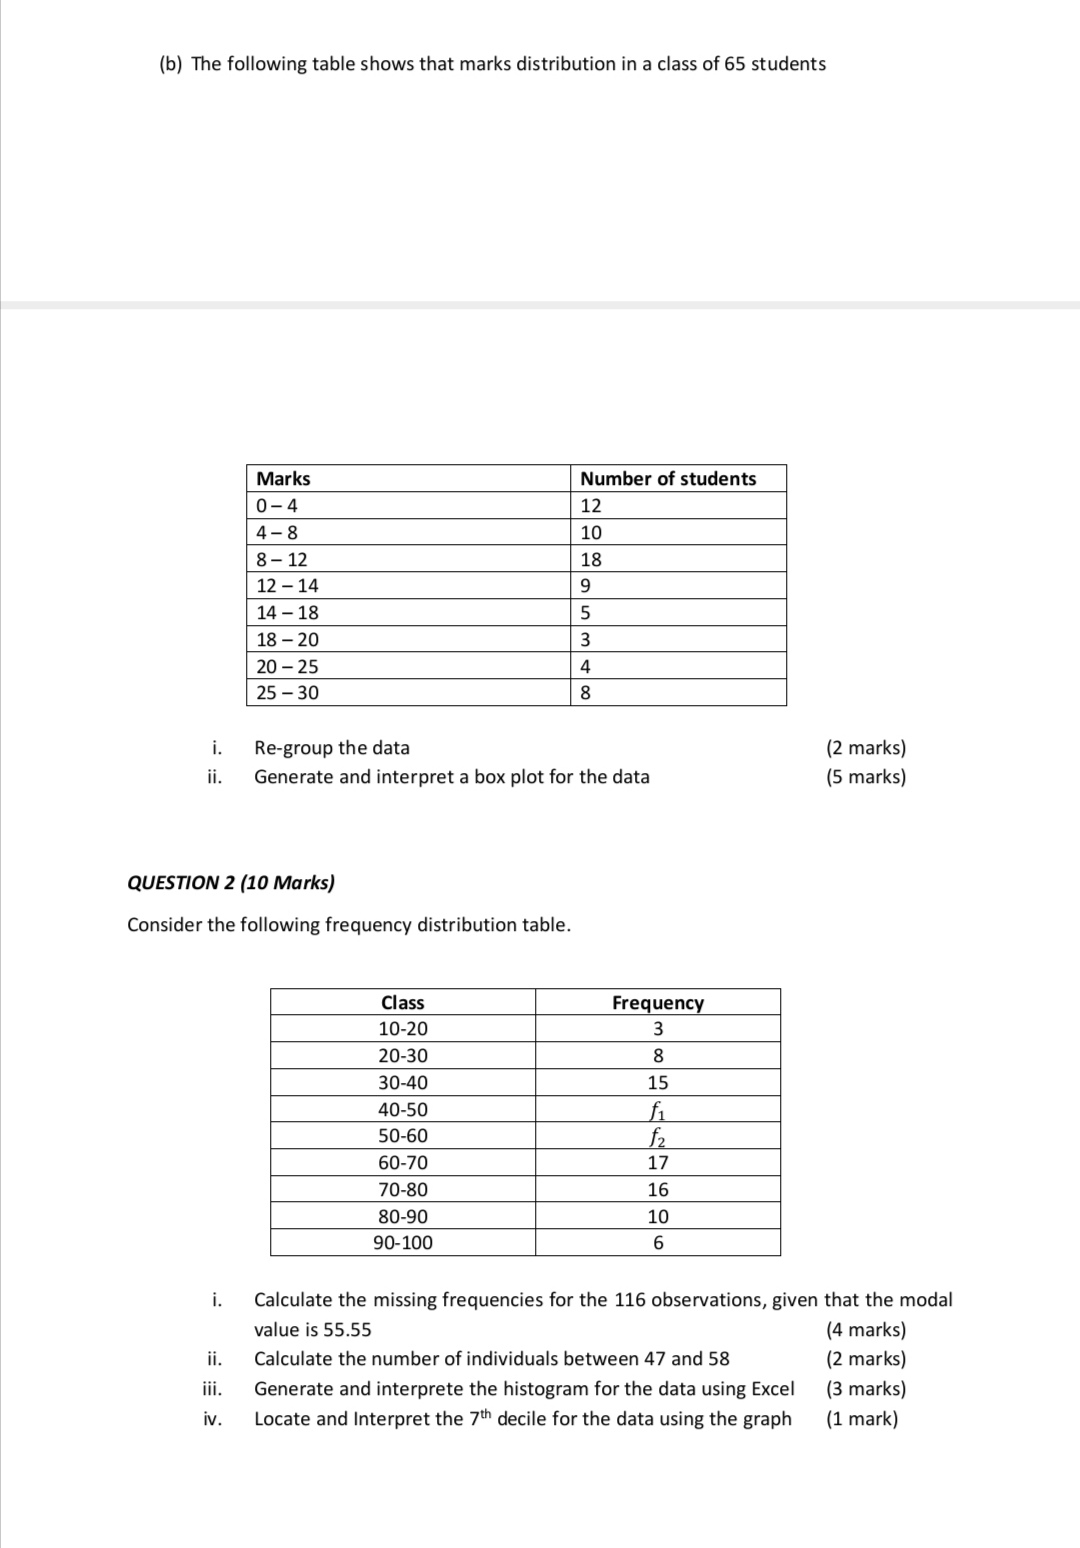
image text in transcribed
(b) The following table shows that marks distribution in a class of 65 students _ Numberofstudents i. Regroup the data (2 marks) ii. Generate and interpret a box plot for the data (5 marks) QUES'HON 2 {10 Marks) Consider the following frequency distribution table. i. Calculate the missing frequencies for the 116 observations, given that the modal value is 55.55 (4 marks) ii. Calculate the number of individuals between 47 and 58 (2 marks) iii. Generate and interprete the histogram for the data using Excel (3 marks) iv. Locate and Interpret the 7'\" decile for the data using the graph (1 mark)

Step by Step Solution

There are 3 Steps involved in it

Step: 1

blur-text-image

Get Instant Access to Expert-Tailored Solutions

See step-by-step solutions with expert insights and AI powered tools for academic success

Step: 2

blur-text-image

Step: 3

blur-text-image

Ace Your Homework with AI

Get the answers you need in no time with our AI-driven, step-by-step assistance

Get Started

Recommended Textbook for

Transportation A Global Supply Chain Perspective

Authors: John J. Coyle, Robert A. Novak, Brian Gibson, Edward J. Bard

8th edition

9781305445352, 1133592961, 130544535X, 978-1133592969

More Books

Students also viewed these Mathematics questions

Question

Which kind of lens is used to make a magnifying glass?

Answered: 1 week ago