Question: The audit manager has provided you with visualizations (created using visualization software) that include additional analytical information about Dandelions investment portfolio. She has asked you
The audit manager has provided you with visualizations (created using visualization software) that include additional analytical information about Dandelion’s investment portfolio. She has asked you to review the visualizations to determine what each shows and how the information might affect our risk assessment. She has also asked that, when determining the impact on our risk assessment, you specify whether the information obtained from visualization assisted you or could assist you in (1) identifying a new risk of material misstatement, (2) assessing or reassessing the risk level of the risks of material misstatement already identified, (3) designing tailored audit procedures, or (4) providing fact-based evidence to support your current risk assessment. In addition, the audit manager has questions about certain visualizations.


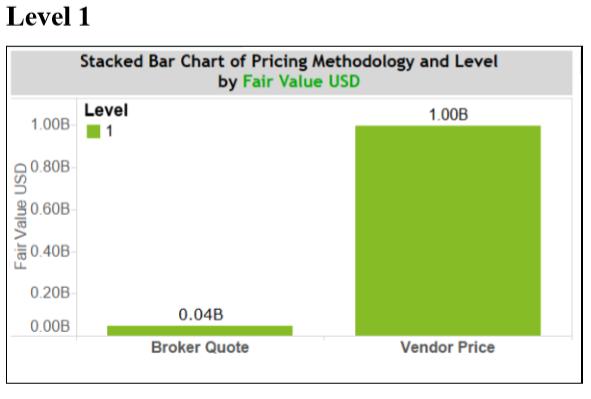
This bar chart is visual representation of the pricing methods for Level 1 securities. (Level 1 in Fair value Hierarchy)
Question | Response |
What do these visualizations show? | |
How might these observations affect our risk assessment? |
Level 1 Securities Book Value Unreal Gains Unreal Losses Fair Value (Debt securities) U.S. treasury $ 733 $ 2 $0 $ 735
Step by Step Solution
3.57 Rating (157 Votes )
There are 3 Steps involved in it
visualization software a data visualization tool is a form of software that is design... View full answer

Get step-by-step solutions from verified subject matter experts


