

Answered step by step
Verified Expert Solution
Question
1 Approved Answer
The average stock prices for each of the four years shown in in Exhibit-4 were as followus a. Compute the price-eamings ( (mathrm{P} / mathrm{E}
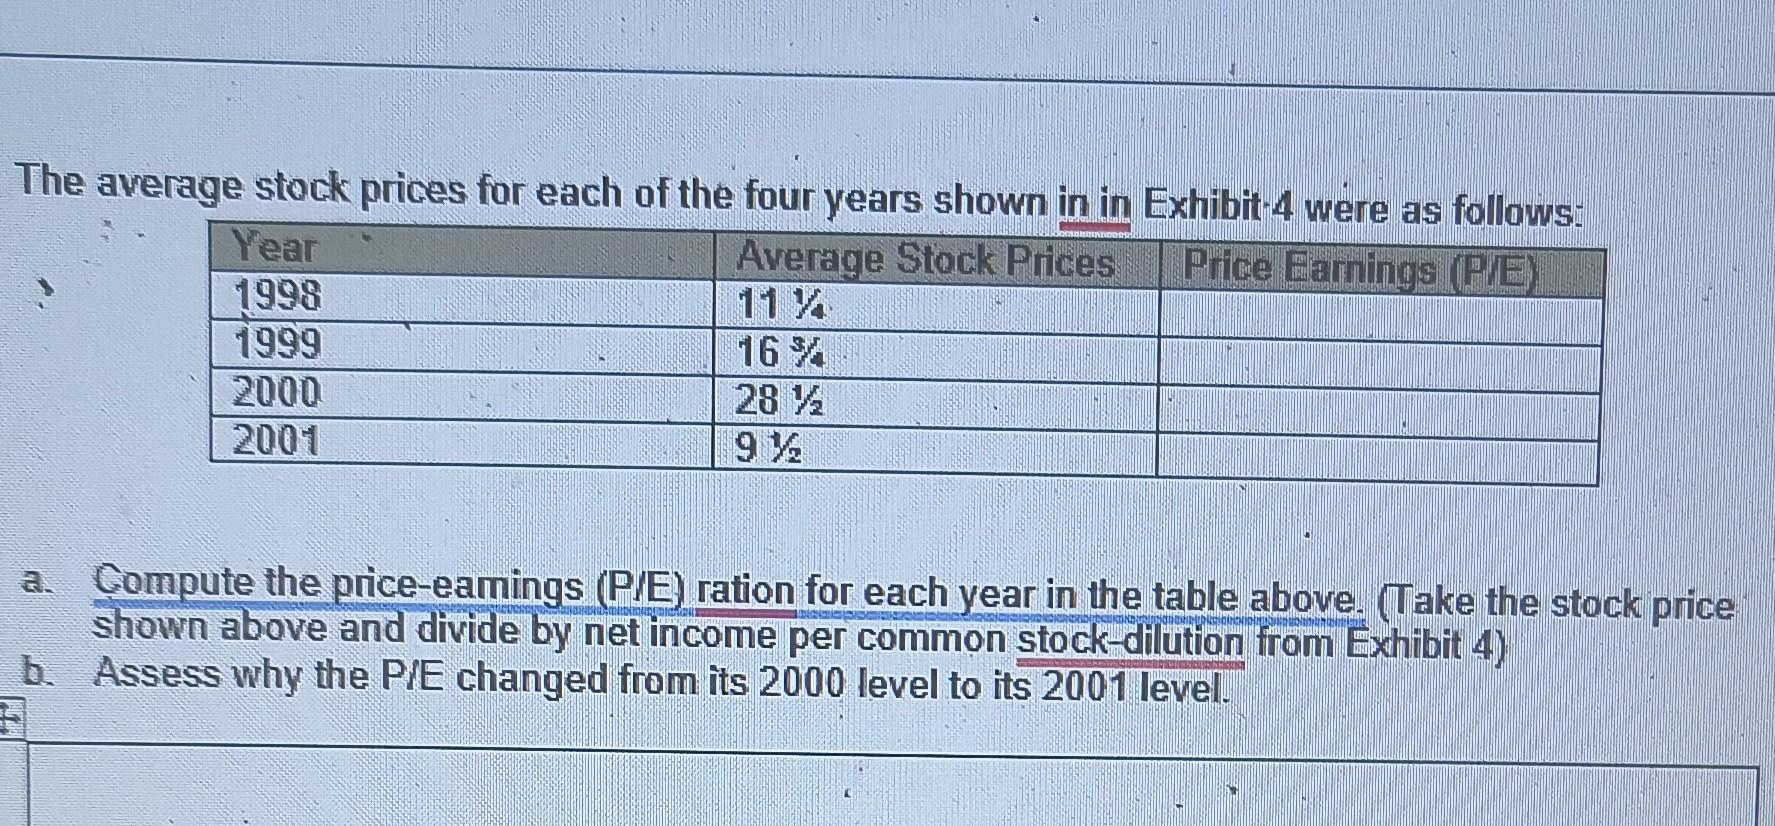
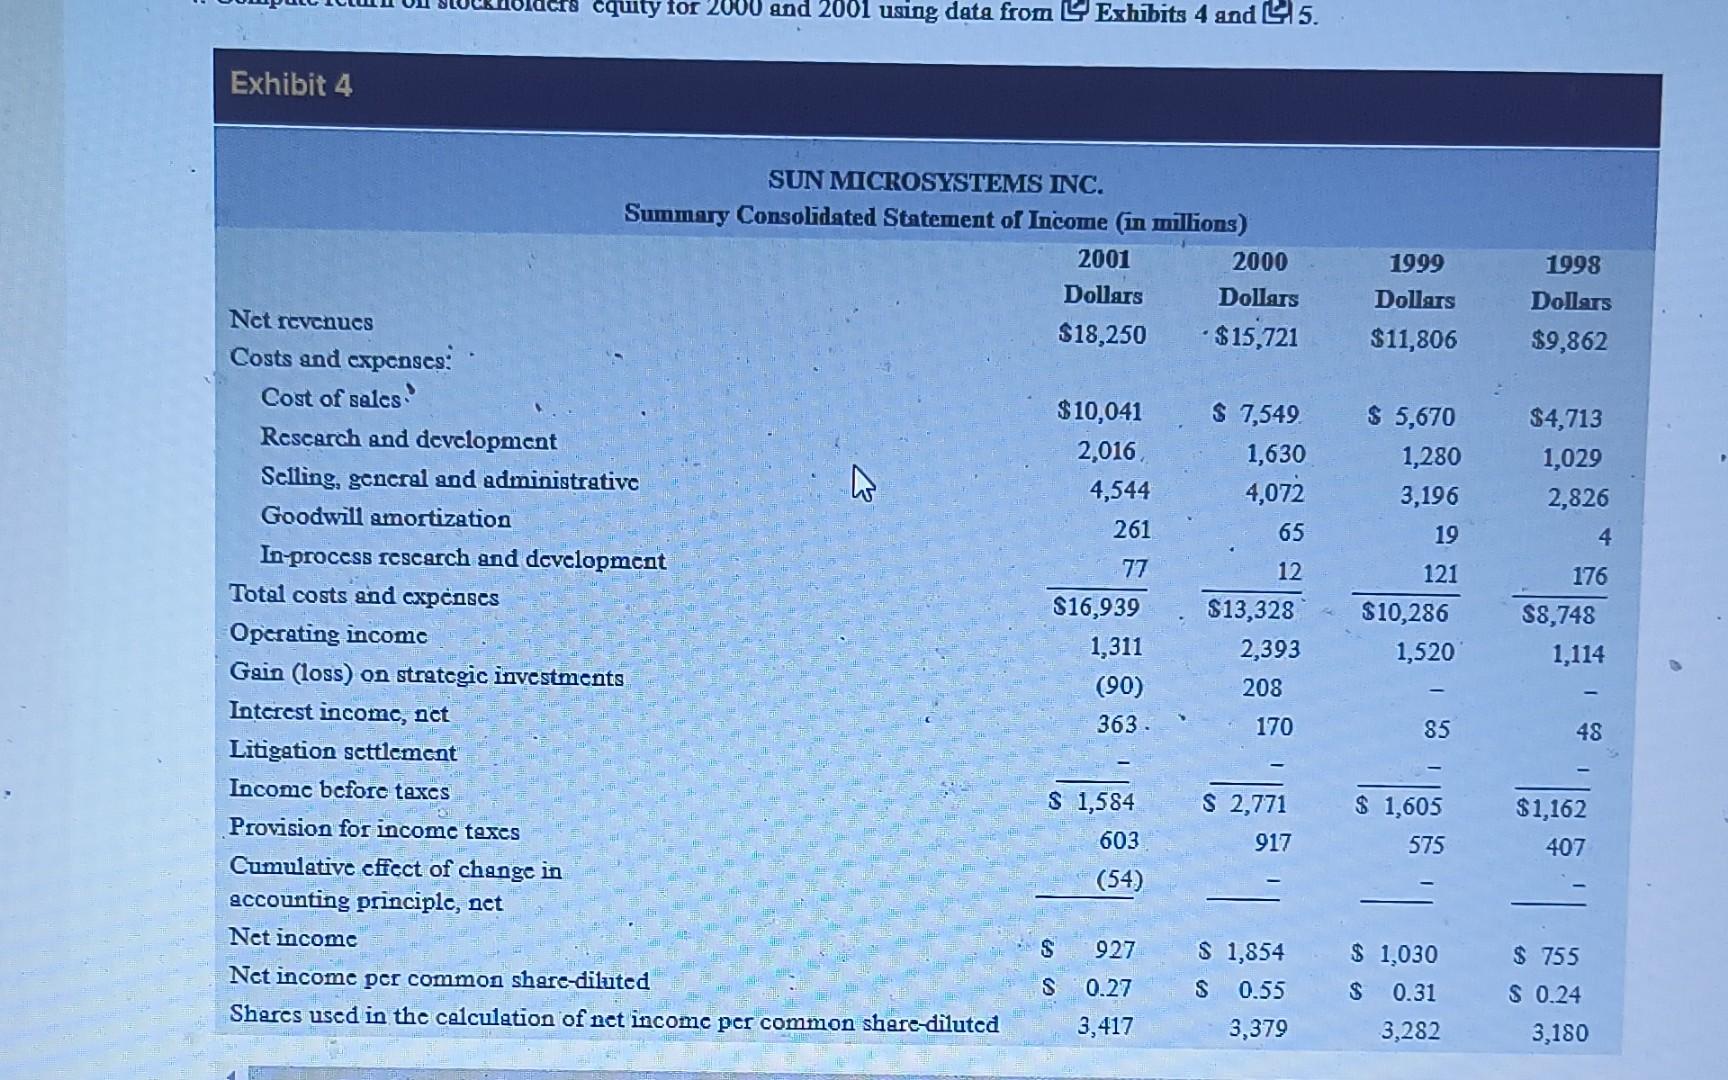
The average stock prices for each of the four years shown in in Exhibit-4 were as followus a. Compute the price-eamings \\( (\\mathrm{P} / \\mathrm{E} \\) ) ration for each year in the table above. (Take the stock price shown above and divide by net income per common stock-dilution from Exhibit 4) b. Assess why the PIE changed from its 2000 level to its 2001 level. Exhibit 4 SUN MICROSYSTEMS INC. Summary Consolidated Statement of Income (in millions) Net revenues Costs and expenses: Cost of sales: Rescarch and development Selling, general and administrative Goodwill amortization In-process research and development Total costs and expenses Operating income Gain (loss) on strategic investments Interest income, net Litigation settlement Income before taxes Provision for income texes Cumulative effect of change in accounting principle, net Net income Net income per common share-diluted Shares used in the calculation of net income per common share-diluted
Step by Step Solution
There are 3 Steps involved in it
Step: 1

Get Instant Access to Expert-Tailored Solutions
See step-by-step solutions with expert insights and AI powered tools for academic success
Step: 2

Step: 3
Ace Your Homework with AI
Get the answers you need in no time with our AI-driven, step-by-step assistance
Get Started
Public Finance
Authors: Harvey Rosen, Ted Gayer
8th Edition
0073511285, 9780073511283