Answered step by step
Verified Expert Solution
Question
1 Approved Answer
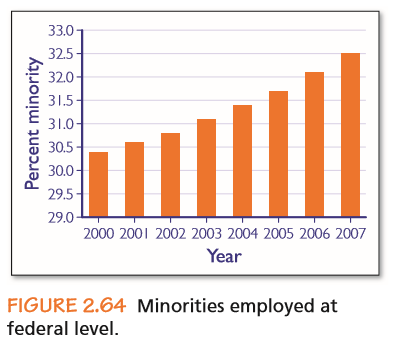
The bar graph in Figure 2.64 shows how the percent of federal employees who are minorities has changed with time.15 By adjusting the vertical range,
The bar graph in Figure 2.64 shows how the percent of federal employees who are minorities has changed with time.15 By adjusting the vertical range, make a bar graph that might accompany an article with the title "Federal employment of minorities shows little change."

Step by Step Solution
There are 3 Steps involved in it
Step: 1

Get Instant Access to Expert-Tailored Solutions
See step-by-step solutions with expert insights and AI powered tools for academic success
Step: 2

Step: 3

Ace Your Homework with AI
Get the answers you need in no time with our AI-driven, step-by-step assistance
Get Started


