Question
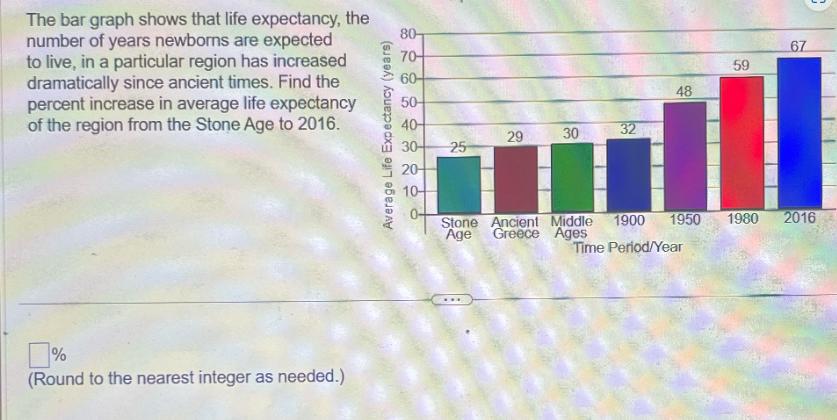
The bar graph shows that life expectancy, the number of years newborns are expected to live, in a particular region has increased dramatically since

The bar graph shows that life expectancy, the number of years newborns are expected to live, in a particular region has increased dramatically since ancient times. Find the percent increase in average life expectancy of the region from the Stone Age to 2016. % (Round to the nearest integer as needed.) Average Life Expectancy (years) 80- 70- 60- 67 59 48 50- 40- 29 30 32 30- 25 20- 10- Stone Ancient Middle 1900 1950 Age Greece Ages 1980 2016 Time Period/Year
Step by Step Solution
There are 3 Steps involved in it
Step: 1
To find the percent increase in average life expectancy from the Stone Age t...
Get Instant Access to Expert-Tailored Solutions
See step-by-step solutions with expert insights and AI powered tools for academic success
Step: 2

Step: 3

Ace Your Homework with AI
Get the answers you need in no time with our AI-driven, step-by-step assistance
Get StartedRecommended Textbook for
Prealgebra
Authors: Elayn Martin Gay
7th edition
321955048, 978-0321955043
Students also viewed these Mathematics questions
Question
Answered: 1 week ago
Question
Answered: 1 week ago
Question
Answered: 1 week ago
Question
Answered: 1 week ago
Question
Answered: 1 week ago
Question
Answered: 1 week ago
Question
Answered: 1 week ago
Question
Answered: 1 week ago
Question
Answered: 1 week ago
Question
Answered: 1 week ago
Question
Answered: 1 week ago
Question
Answered: 1 week ago
Question
Answered: 1 week ago
Question
Answered: 1 week ago
Question
Answered: 1 week ago
Question
Answered: 1 week ago
Question
Answered: 1 week ago
Question
Answered: 1 week ago
Question
Answered: 1 week ago
Question
Answered: 1 week ago
Question
Answered: 1 week ago
View Answer in SolutionInn App


