

Question: The bar graph shows the wage gap between men and women for selected years from 1980 through 2020. The function G(x)= -0.01x+x+65 models the
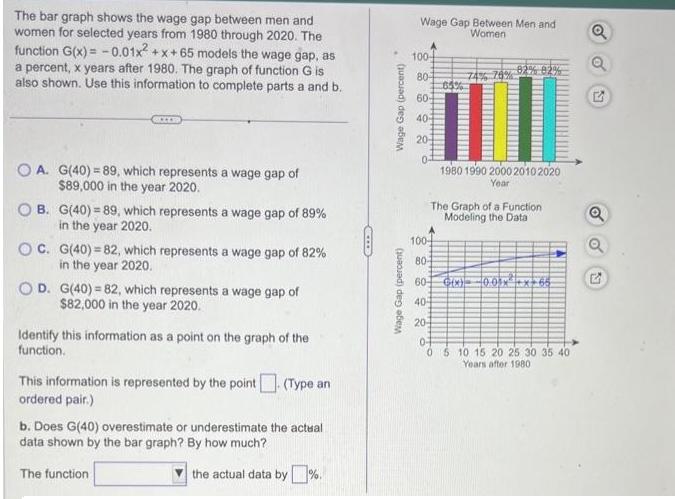
The bar graph shows the wage gap between men and women for selected years from 1980 through 2020. The function G(x)= -0.01x+x+65 models the wage gap, as a percent, x years after 1980. The graph of function G is also shown. Use this information to complete parts a and b. OA. G(40)=89, which represents a wage gap of $89,000 in the year 2020. OB. G(40)=89, which represents a wage gap of 89% in the year 2020. OC. G(40)=82, which represents a wage gap of 82% in the year 2020. OD. G(40)=82, which represents a wage gap of $82,000 in the year 2020. Identify this information as a point on the graph of the function. This information is represented by the point (Type an ordered pair.) b. Does G(40) overestimate or underestimate the actual data shown by the bar graph? By how much? The function the actual data by%. ACCED Wage Gap (percent) Wage Gap (percent) Wage Gap Between Men and Women 100- 80 60- 40- 20- 03 71 1980 1990 2000 2010 2020 Year 20 The Graph of a Function Modeling the Data 100- 80- 60 Gix)-00x+x+66 40 0- 0 5 10 15 20 25 30 35 40 Years after 1980 Q Q G Q
Step by Step Solution
3.41 Rating (160 Votes )
There are 3 Steps involved in it
a GX 001xx65 In the year 2020 x20201980 40 x240 G40 001 40 4065 Corred Ans B G40 ... View full answer

Get step-by-step solutions from verified subject matter experts