

Answered step by step
Verified Expert Solution
Question
1 Approved Answer
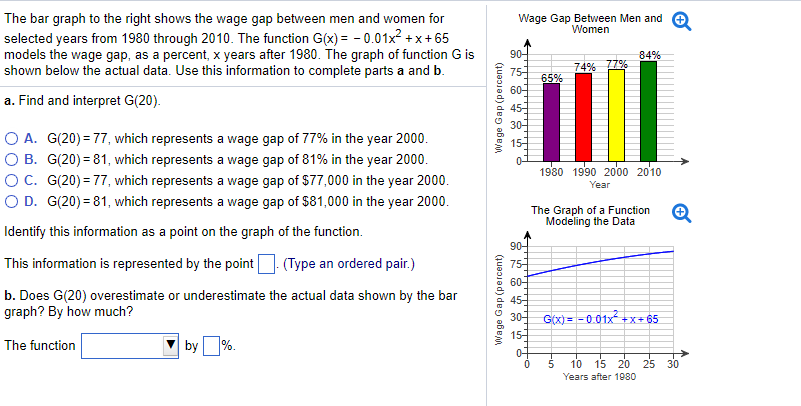
The bar graph to the right shows the wage gap between men and women for selected years from 1980 through 2010. The function ?G(x) f
The bar graph to the right shows the wage gap between men and women for selected years from 1980 through 2010. The function ?G(x)
Step by Step Solution
There are 3 Steps involved in it
Step: 1

Get Instant Access to Expert-Tailored Solutions
See step-by-step solutions with expert insights and AI powered tools for academic success
Step: 2

Step: 3
Ace Your Homework with AI
Get the answers you need in no time with our AI-driven, step-by-step assistance
Get Started
Linear Algebra and Its Applications
Authors: David C. Lay
4th edition
321791541, 978-0321388834, 978-0321791542