

Answered step by step
Verified Expert Solution
Question
1 Approved Answer
The below data pertains to the stock prices of two companies, Nike and Puma. Use the information to answer questions 11 to 13 Rate of
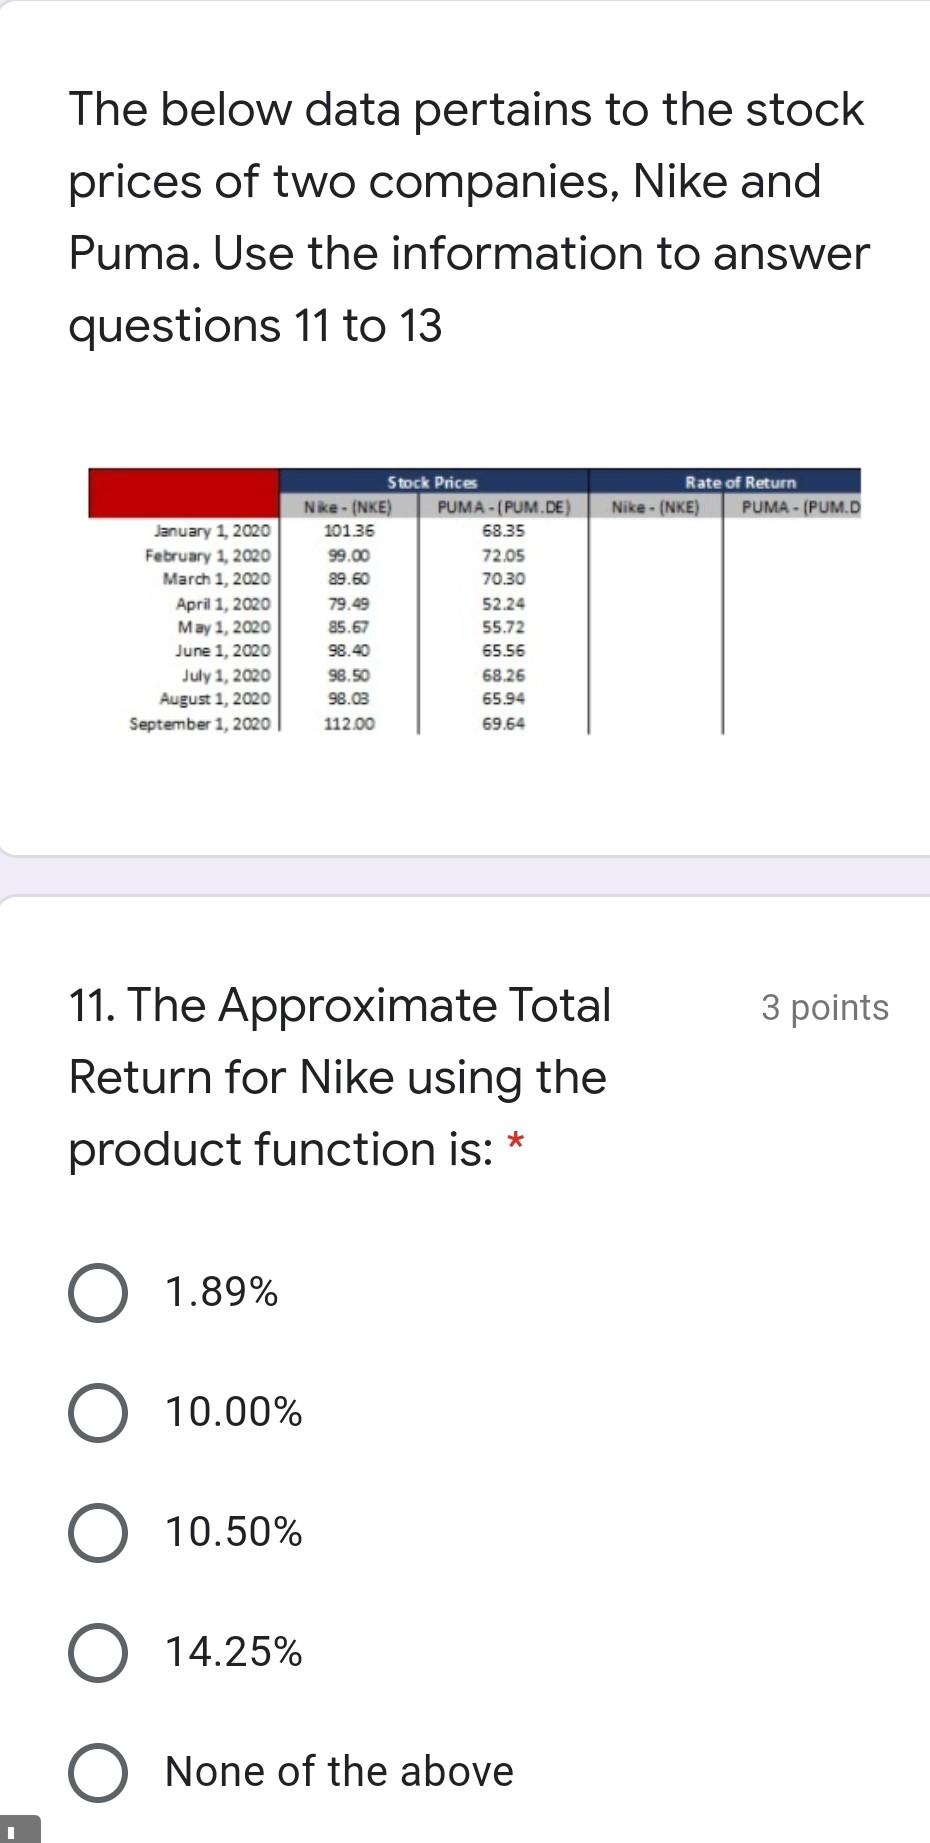
The below data pertains to the stock prices of two companies, Nike and Puma. Use the information to answer questions 11 to 13 Rate of Return Nike - (NKE) PUMA - (PUM.D January 1, 2020 February 1, 2020 March 1, 2020 April 1, 2020 May 1, 2020 June 1, 2020 July 1, 2020 August 1, 2020 September 1, 2020 Stock Prices Nike - (NKE) PUMA - (PUM.DE) 101.36 68.35 99.00 72.05 89.60 70.30 79.49 52.24 85.67 55.72 98.40 65.56 98.50 68.26 98.03 65.94 112.00 69,64 3 points 11. The Approximate Total Return for Nike using the product function is: * 1.89% 10.00% 10.50% 14.25% O None of the above
Step by Step Solution
There are 3 Steps involved in it
Step: 1

Get Instant Access to Expert-Tailored Solutions
See step-by-step solutions with expert insights and AI powered tools for academic success
Step: 2

Step: 3
Ace Your Homework with AI
Get the answers you need in no time with our AI-driven, step-by-step assistance
Get Started
Financial Data Analytics Theory And Application
Authors: Sinem Derindere Köseo?lu
1st Edition
303083798X,3030837998