Answered step by step
Verified Expert Solution
Question
1 Approved Answer
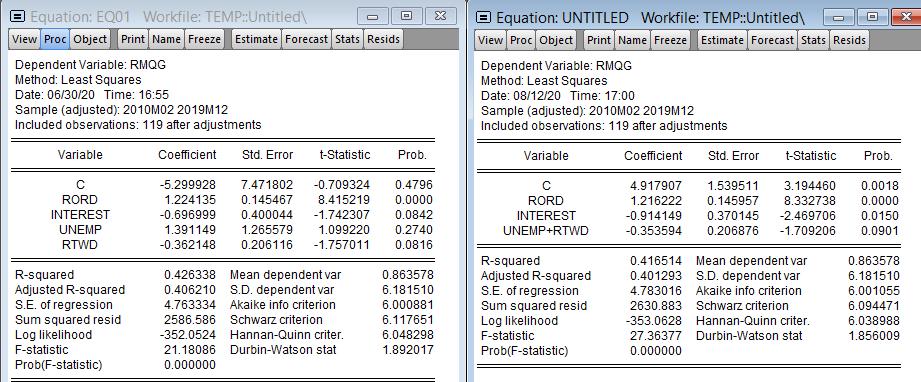
The below is a regression output for a stock return of a bank (RMQG) against the market return (RORD), interest rate (INTEREST), unemployment rate


The below is a regression output for a stock return of a bank (RMQG) against the market return (RORD), interest rate (INTEREST), unemployment rate (UNEMP), and change in (trade-weighted) exchange rate (RTWD) of Australia using the monthly data from 2010 to 2019 (119 observations). All variables are expressed in percentages (9). The full model can be written as RMQG=1+2RORD+B3INEREST+4UNEMP+5RTWD+eRMQG-B1+2RORD+3INEREST+4UNEMP+5RTWD+e One regression result is associated with restricted regression and the other with unrestricted regression. What are the degrees of freedom for the F-test statistic for the null hypothesis that 4=54=5? X Equation: UNTITLED Workfile: TEMP::Untitled\ View Proc Object Print Name Freeze Estimate Forecast Stats Resids Dependent Variable: RMQG Method: Least Squares Date: 08/12/20 Time: 17:00 Sample (adjusted): 2010M02 2019M12 Included observations: 119 after adjustments Equation: EQ01 Workfile: TEMP::Untitled\ View Proc Object Print Name Freeze Estimate Forecast Stats Resids Dependent Variable: RMQG Method: Least Squares Date: 06/30/20 Time: 16:55 Sample (adjusted): 2010M02 2019M12 Included observations: 119 after adjustments Variable Coefficient Std. Error t-Statistic Prob. Variable Coefficient Std. Error t-Statistic Prob. C RORD INTEREST UNEMP RTWD -5.299928 7.471802 -0.709324 0.4796 1.224135 0.145467 8.415219 0.0000 -0.696999 0.400044 -1.742307 0.0842 1.391149 1.265579 1.099220 0.2740 -0.362148 0.206116 -1.757011 0.0816 C RORD INTEREST UNEMP+RTWD 4.917907 1.216222 -0.914149 -0.353594 1.539511 3.194460 0.0018 0.145957 8.332738 0.0000 0.370145 -2.469706 0.0150 0.206876 -1.709206 0.0901 R-squared 0.416514 Mean dependent var 0.863578 R-squared Adjusted R-squared S.E. of regression 0.426338 Mean dependent var 0.863578 0.406210 S.D. dependent var 6.181510 4.763334 Akaike info criterion 6.000881 Sum squared resid 2586.586 Schwarz criterion 6.117651 Adjusted R-squared S.E. of regression Sum squared resid Log likelihood 0.401293 S.D. dependent var 6.181510 4.783016 Akaike info criterion 6.001055 2630.883 Schwarz criterion 6.094471 -353.0628 Hannan-Quinn criter. 6.038988 Log likelihood -352.0524 Hannan-Quinn criter. 6.048298 F-statistic F-statistic 21.18086 Durbin-Watson stat 1.892017 Prob(F-statistic) 27.36377 0.000000 Durbin-Watson stat 1.856009 Prob(F-statistic) 0.000000
Step by Step Solution
There are 3 Steps involved in it
Step: 1

Get Instant Access to Expert-Tailored Solutions
See step-by-step solutions with expert insights and AI powered tools for academic success
Step: 2

Step: 3

Ace Your Homework with AI
Get the answers you need in no time with our AI-driven, step-by-step assistance
Get Started


