Answered step by step
Verified Expert Solution
Question
1 Approved Answer
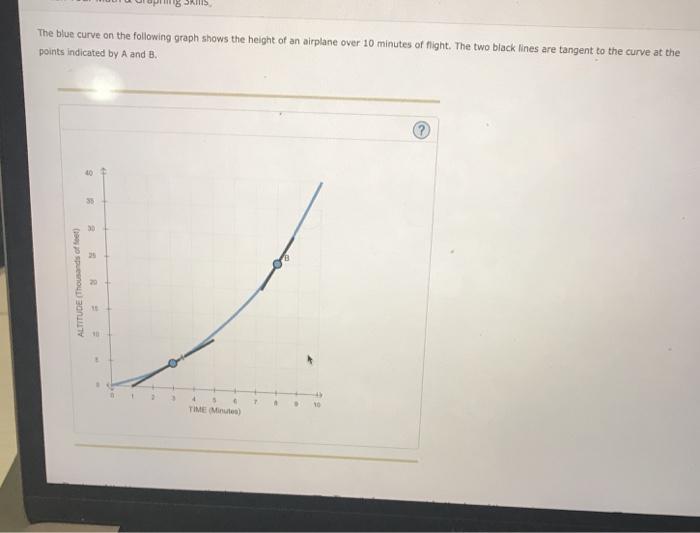
The blue curve on the following graph shows the height of an airplane over 10 minutes of flight. The two black lines are tangent


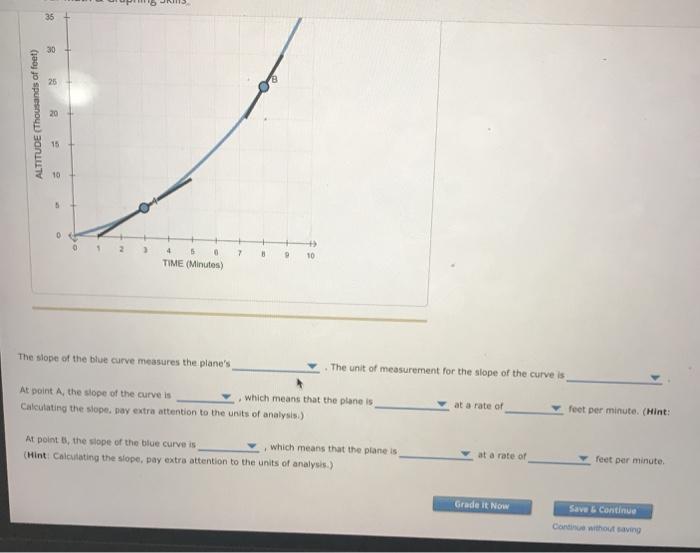
The blue curve on the following graph shows the height of an airplane over 10 minutes of flight. The two black lines are tangent to the curve at the points indicated by A and B. 40 35 30 25 TME Muten) ALTITUDE (Thousands of feet) 35 30 26 20 15 10 01 23 4 10 TIME (Minutes) The slope of the blue curve measures the plane's The unit of measurement for the slope of the curve is At point A, the slope of the curve is , which means that the plane is at a rate of feet per minute. (Hint: Calcutating the slope, pay extra attention to the units of analysis.) At point B, the slope of the blue curve is , which means that the plane is at a rate of feet per minute. (Hint: Calculating the slope, pay extra attention to the units of analysis) Grade it Now Save & Continue Continue without saving ALTITUDE (Thousands of feet)
Step by Step Solution
★★★★★
3.44 Rating (160 Votes )
There are 3 Steps involved in it
Step: 1
The sle f the blue urve mesures the lnes rte f sent The unit f mesurement is thusnds f feet er m...
Get Instant Access to Expert-Tailored Solutions
See step-by-step solutions with expert insights and AI powered tools for academic success
Step: 2

Step: 3

Ace Your Homework with AI
Get the answers you need in no time with our AI-driven, step-by-step assistance
Get Started


