

Answered step by step
Verified Expert Solution
Question
1 Approved Answer
The box plot represents the weekly salaries (in dollars) of 80 randomly selected employees of a company. The five-number summary that was used to
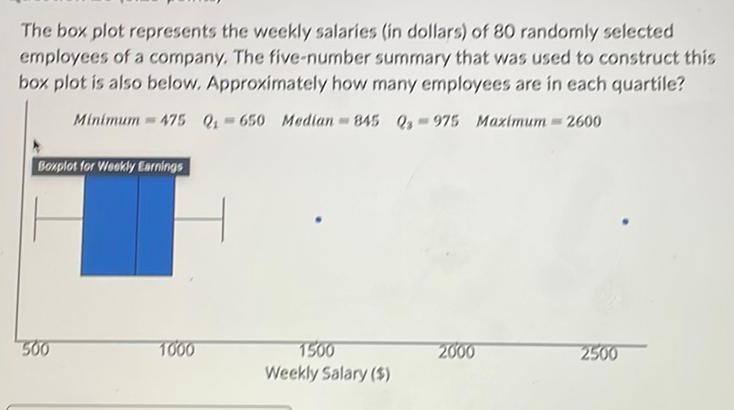
The box plot represents the weekly salaries (in dollars) of 80 randomly selected employees of a company. The five-number summary that was used to construct this box plot is also below. Approximately how many employees are in each quartile? Minimum 475 Q 650 Median 845 Q-975 Maximum = 2600 Boxplot for Weekly Earnings 500 1000 1500 2000 2500 Weekly Salary ($)
Step by Step Solution
There are 3 Steps involved in it
Step: 1

Get Instant Access to Expert-Tailored Solutions
See step-by-step solutions with expert insights and AI powered tools for academic success
Step: 2

Step: 3
Ace Your Homework with AI
Get the answers you need in no time with our AI-driven, step-by-step assistance
Get Started
Advanced Engineering Mathematics
Authors: Erwin Kreyszig
4th Edition
471021407, 9780471021407