

Answered step by step
Verified Expert Solution
Question
1 Approved Answer
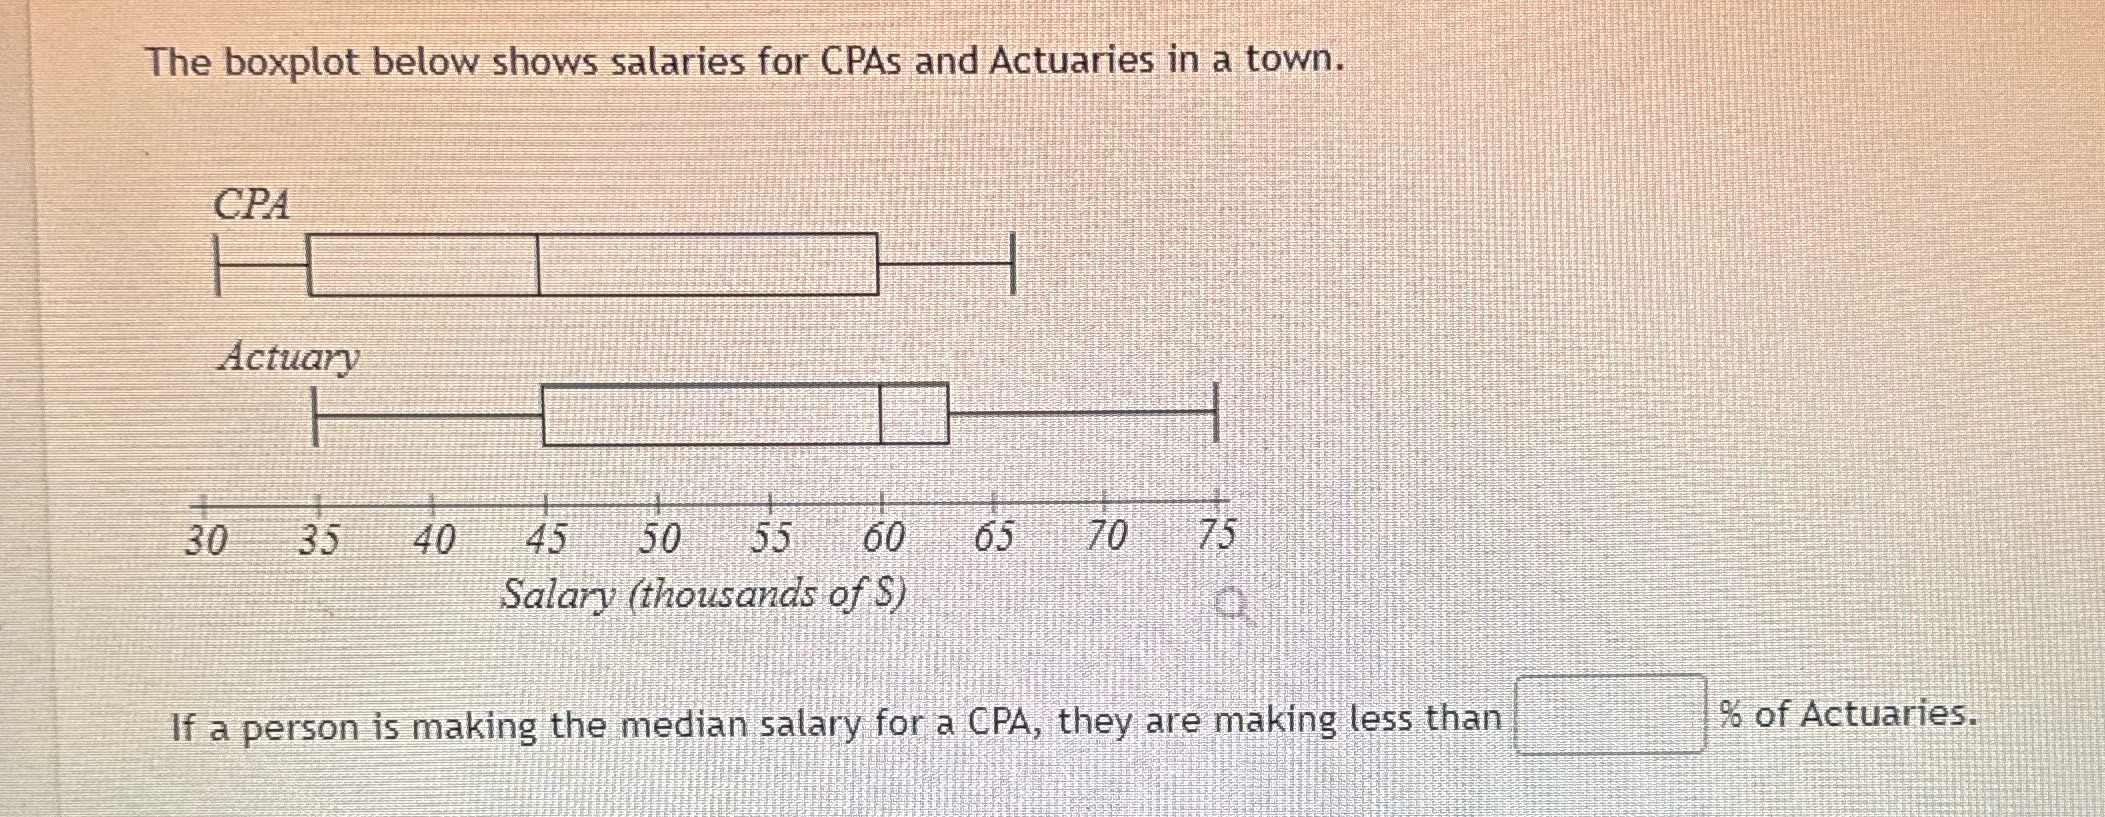
The boxplot below shows salaries for CPAs and Actuaries in a town. CPA Actuary 30 35 40 45 50 55 60 65 70 75 Salary
Step by Step Solution
There are 3 Steps involved in it
Step: 1

Get Instant Access to Expert-Tailored Solutions
See step-by-step solutions with expert insights and AI powered tools for academic success
Step: 2

Step: 3
Ace Your Homework with AI
Get the answers you need in no time with our AI-driven, step-by-step assistance
Get Started
Intro Stats
Authors: Richard D. De Veaux, Paul F. Velleman, David E. Bock
3rd edition
321533283, 321533289, 9780321463708, 9780321503848, 9780321503800, 9780321499431, 9780321499417, 978-0321500458