Answered step by step
Verified Expert Solution
Question
1 Approved Answer
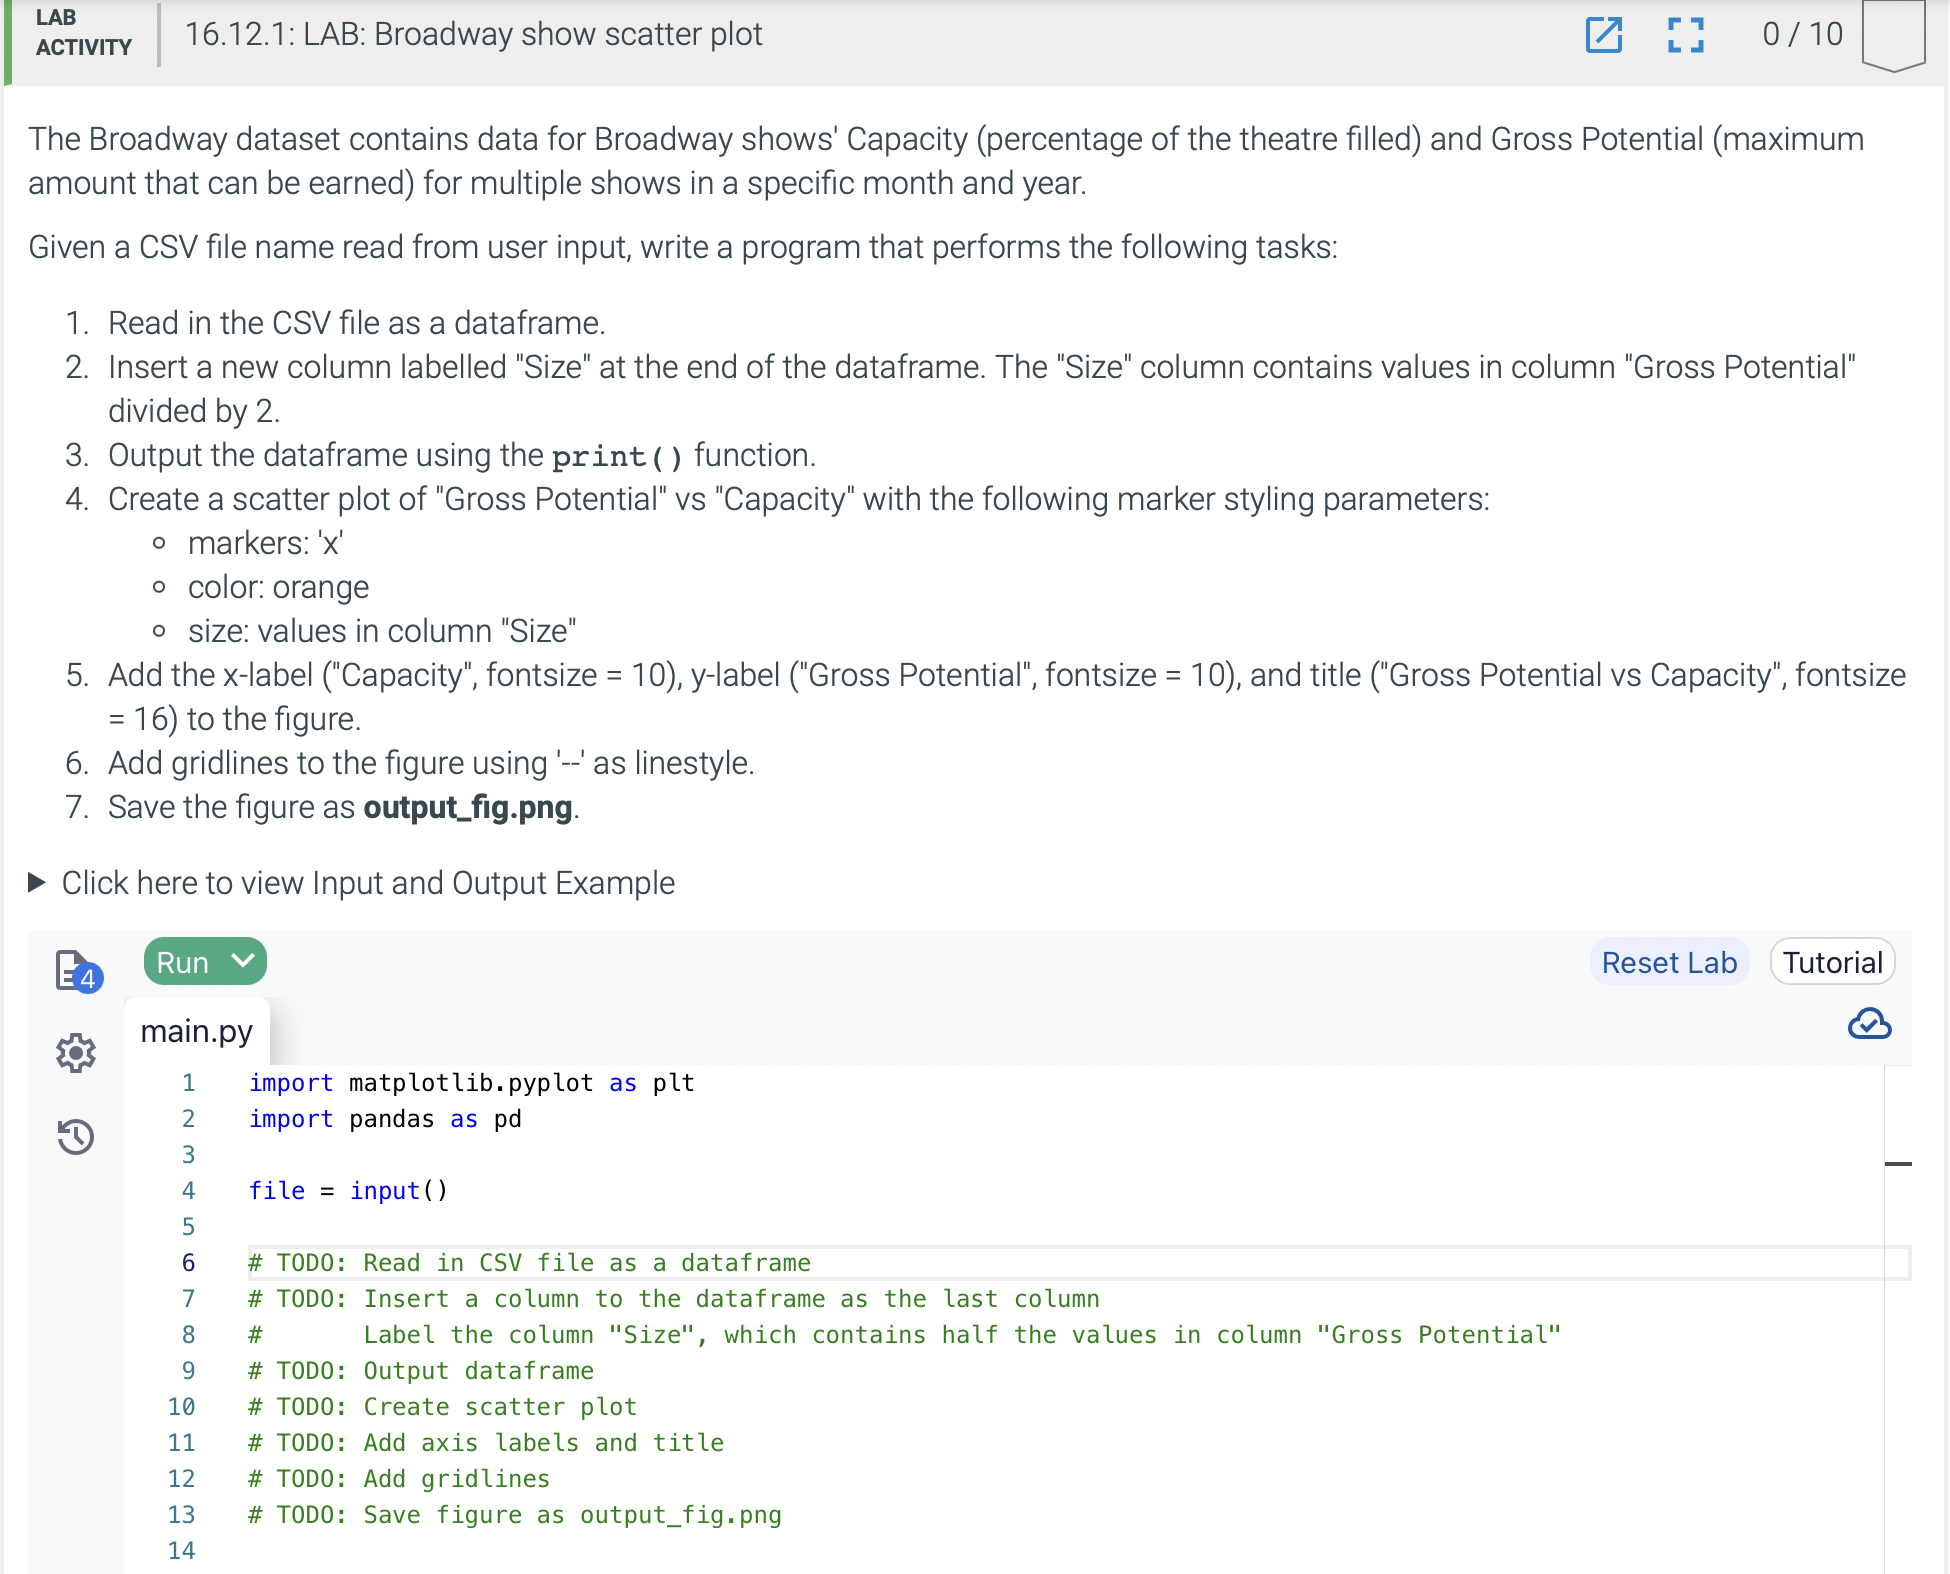
The Broadway dataset contains data for Broadway shows' Capacity ( percentage of the theatre filled ) and Gross Potential ( maximum amount that can be
The Broadway dataset contains data for Broadway shows' Capacity percentage of the theatre filled and Gross Potential maximum
amount that can be earned for multiple shows in a specific month and year.
Given a CSV file name read from user input, write a program that performs the following tasks:
Read in the CSV file as a dataframe.
Insert a new column labelled "Size" at the end of the dataframe. The "Size" column contains values in column "Gross Potential"
divided by
Output the dataframe using the print function.
Create a scatter plot of "Gross Potential" vs "Capacity" with the following marker styling parameters:
markers: x
color: orange
size: values in column "Size"
Add the xlabel Capacity fontsize ylabel Gross Potential", fontsize and title Gross Potential vs Capacity", fontsize
to the figure.
Add gridlines to the figure using as linestyle.
Save the figure as outputfig.png
Click here to view Input and Output Example
E
Run
main.py
import matplotlib.pyplot as plt
import pandas as pd
file input
# TODO: Read in CSV file as a dataframe
# TODO: Insert a column to the dataframe as the last column
# Label the column "Size", which contains half the values in column "Gross Potential"
# TOD: Output dataframe
# TOD: Create scatter plot
# TODO: Add axis labels and title
# TOD: Add gridlines
# TODO: Save figure as outputfig.png

Step by Step Solution
There are 3 Steps involved in it
Step: 1

Get Instant Access to Expert-Tailored Solutions
See step-by-step solutions with expert insights and AI powered tools for academic success
Step: 2

Step: 3

Ace Your Homework with AI
Get the answers you need in no time with our AI-driven, step-by-step assistance
Get Started


