Question
The CEO of R B Patel has made a proposal to its board to make a take-over offer of PBL Ltd. He is proposing to
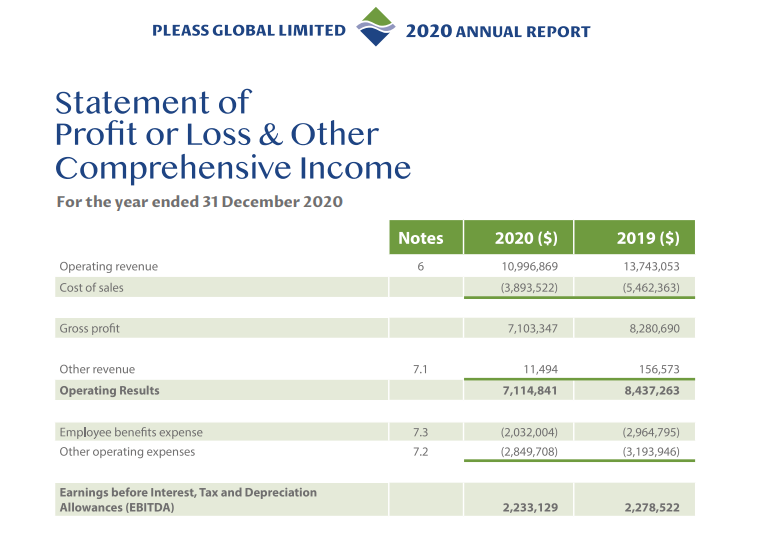
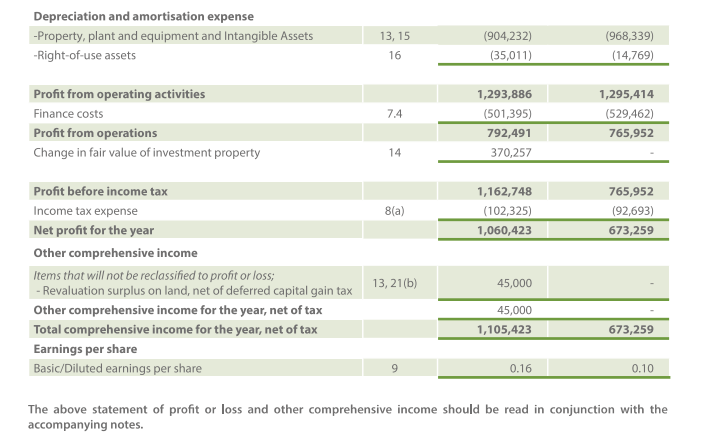
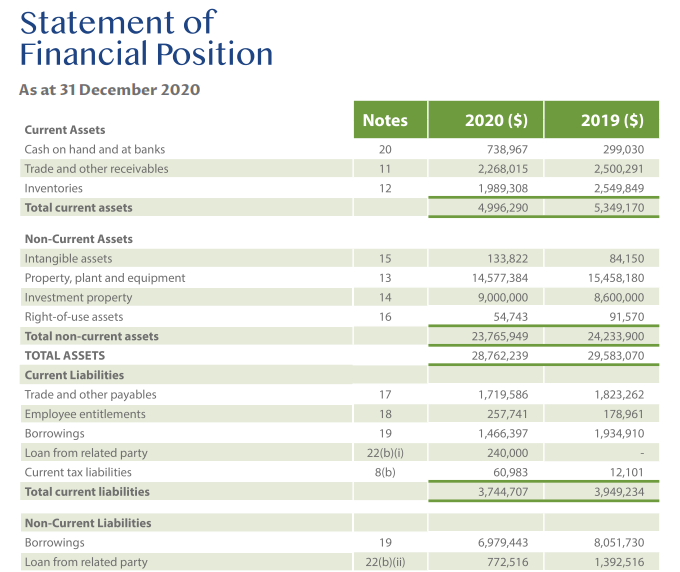
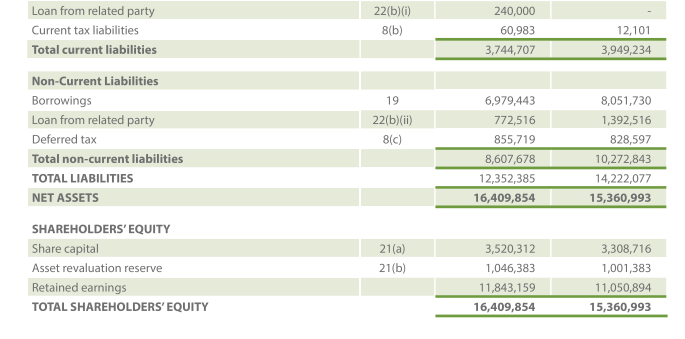
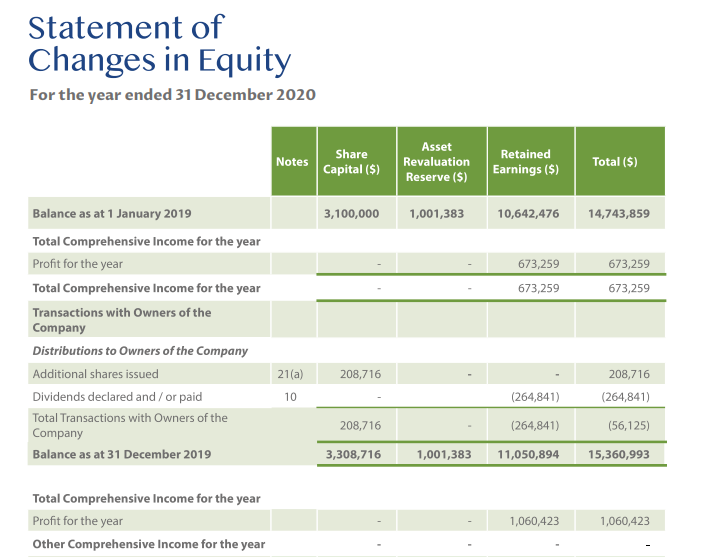
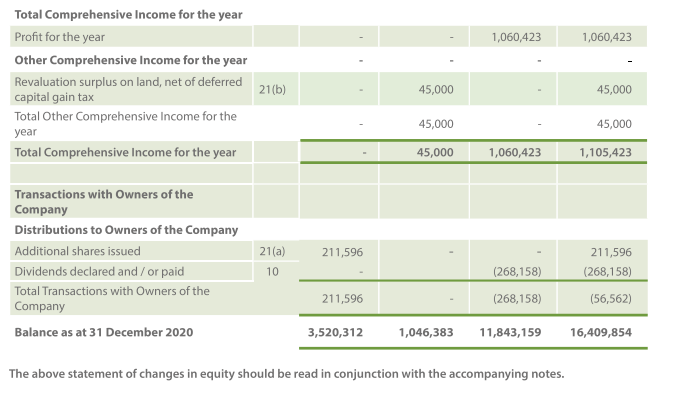
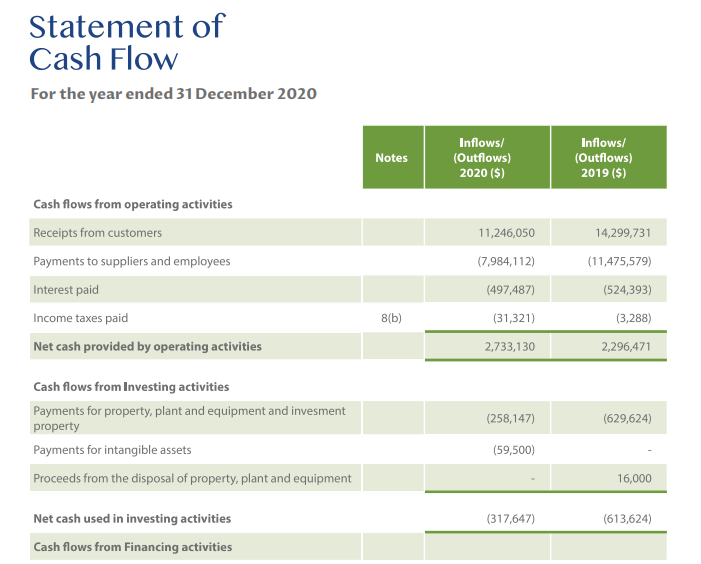
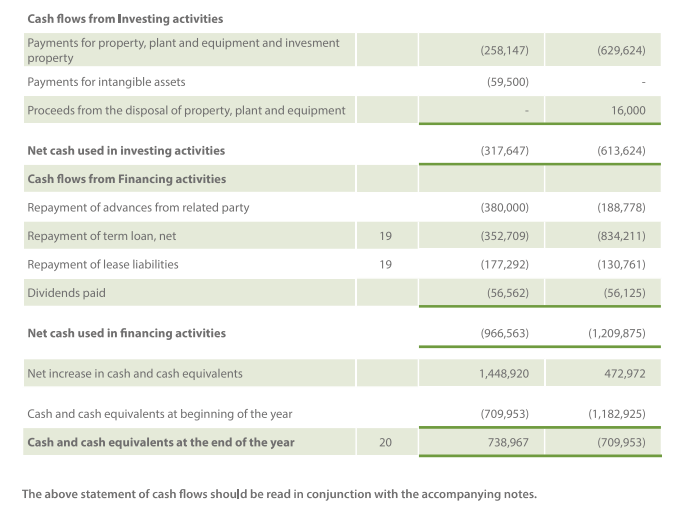
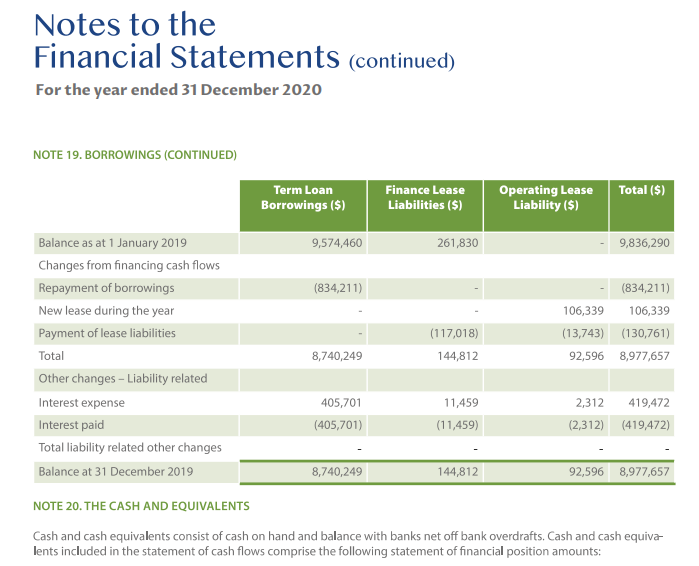
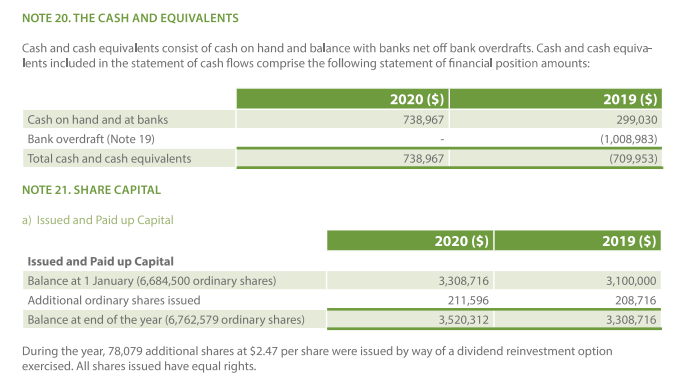
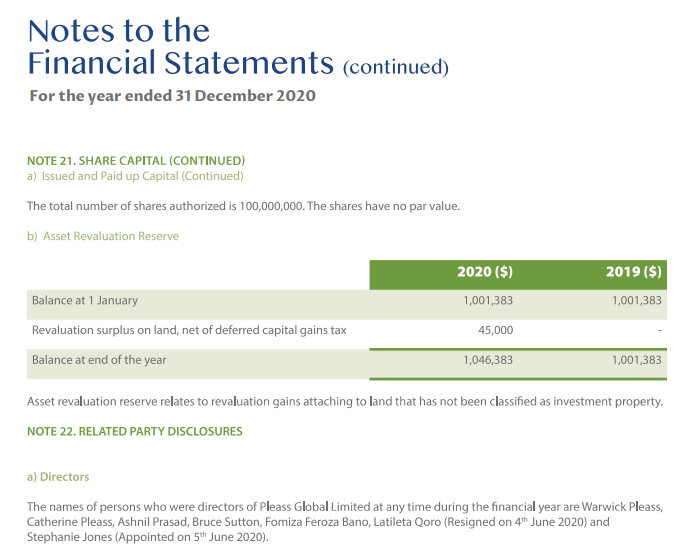
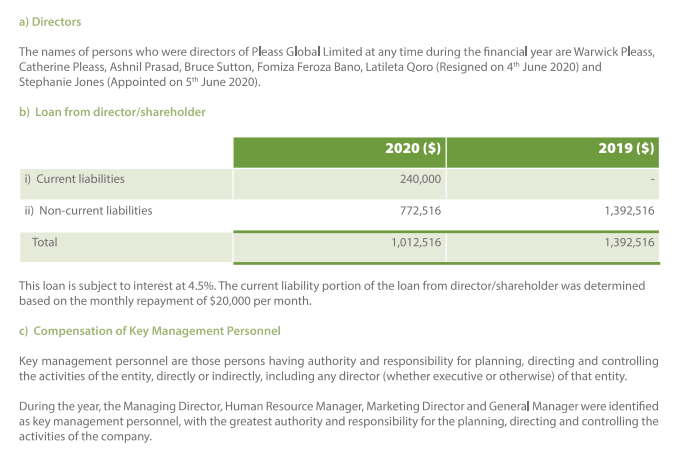
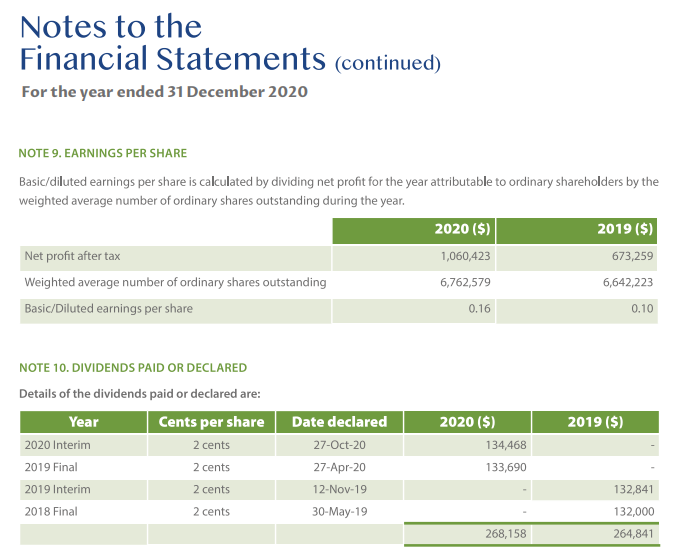 The CEO of R B Patel has made a proposal to its board to make a take-over offer of PBL Ltd. He is proposing to pay $3.15 per share. The current market share of PBL Ltd is $3.03. The CEO of R B Patel Ltd justifies the price offer, indicating that R B Patel is the largest customer of PBL Ltd, buying and retailing all the drinking water. It will be a natural addition to their business. The CEO of R B Patel indicates that the water business will grow at 2% per year and hence dividends will also grow at this rate. PBL Ltd has a beta of 1.2 and 15-year government bonds yield 1.5%. The average market returns on the stock exchange where PBL Ltd trades is 3.5%. Refer to the PBL Ltd 2020 Financials provided.
Required
The board of R B Patel is not convinced with the offer price and seeks your advice. Prepare a report for the R B Patel board whether the offer price is justified. Your report should include three different approaches. Show all your calculations. (20 marks)
PLEASS GLOBAL LIMITED 2020 ANNUAL REPORT Statement of Profit or Loss & Other Comprehensive Income For the year ended 31 December 2020 Notes Operating revenue Cost of sales 6 2020 ($) 10,996,869 (3,893,522) 2019 ($) 13,743,053 (5,462,363) Gross profit 7,103,347 8,280,690 7.1 Other revenue Operating Results 11,494 7,114,841 156,573 8,437,263 Employee benefits expense Other operating expenses 7.3 7.2 (2,032,004) (2,849,708) (2,964,795) (3,193,946) Earnings before Interest, Tax and Depreciation Allowances (EBITDA) 2,233,129 2,278,522 Depreciation and amortisation expense - Property, plant and equipment and Intangible Assets -Right-of-use assets 13,15 16 (904,232) (35,011) (968,339) (14,769) 7.4 Profit from operating activities Finance costs Profit from operations Change in fair value of investment property 1,293,886 (501,395) 792,491 370,257 1,295,414 (529,462) 765,952 14 8(a) 1,162,748 (102,325) 1,060,423 765,952 (92,693) 673,259 Profit before income tax Income tax expense Net profit for the year Other comprehensive income Items that will not be reclassified to profit or loss; - Revaluation surplus on land, net of deferred capital gain tax Other comprehensive income for the year, net of tax Total comprehensive income for the year, net of tax Earnings per share Basic/Diluted earnings per share 13,21(b) 45,000 45,000 1,105,423 673,259 0.16 0.10 The above statement of profit or loss and other comprehensive income should be read in conjunction with the accompanying notes. Statement of Financial Position As at 31 December 2020 Notes 20 11 12 2020 ($) 738,967 2,268,015 1,989,308 4,996,290 2019 ($) 299,030 2,500,291 2,549,849 5,349,170 15 13 14 Current Assets Cash on hand and at banks Trade and other receivables Inventories Total current assets Non-Current Assets Intangible assets Property, plant and equipment Investment property Right-of-use assets Total non-current assets TOTAL ASSETS Current Liabilities Trade and other payables Employee entitlements Borrowings Loan from related party Current tax liabilities Total current liabilities 133,822 14,577,384 9,000,000 54,743 23,765,949 28,762,239 84,150 15,458,180 8,600,000 91,570 24,233,900 29,583,070 16 17 18 1,823,262 178,961 1,934,910 19 1,719,586 257,741 1,466,397 240,000 60,983 3,744,707 22(b) (i) 8(b) ) 12,101 3,949,234 Non-Current Liabilities Borrowings Loan from related party 19 6,979,443 772,516 8,051,730 1,392,516 22(b)(ii) Loan from related party Current tax liabilities Total current liabilities 22(b)(0) 8(b) 240,000 60,983 3,744,707 12,101 3,949,234 Non-Current Liabilities Borrowings Loan from related party Deferred tax Total non-current liabilities TOTAL LIABILITIES NET ASSETS 19 22(b)(11) 8(c) 6,979,443 772,516 855,719 8,607,678 12,352,385 16,409,854 8,051,730 1,392,516 828,597 10,272,843 14,222,077 15,360,993 SHAREHOLDERS' EQUITY Share capital Asset revaluation reserve Retained earnings TOTAL SHAREHOLDERS' EQUITY 21(a) 21(b) 3,520,312 1,046,383 11,843,159 16,409,854 3,308,716 1,001,383 11,050,894 15,360,993 Statement of Changes in Equity For the year ended 31 December 2020 Notes Capital ($) Share Asset Revaluation Reserve ($) Retained Earnings ($) Total ($) 3,100,000 1,001,383 10,642,476 14,743,859 673,259 673,259 673,259 673,259 Balance as at 1 January 2019 Total Comprehensive Income for the year Profit for the year Total Comprehensive Income for the year Transactions with Owners of the Company Distributions to Owners of the Company Additional shares issued Dividends declared and / or paid Total Transactions with Owners of the Company Balance as at 31 December 2019 21(a) 208,716 208,716 (264,841) 10 (264,841) 208,716 (264,841) (56,125) 3,308,716 1,001,383 11,050,894 15,360,993 Total Comprehensive Income for the year Profit for the year Other Comprehensive Income for the year 1,060,423 1,060,423 1,060,423 1,060,423 Total Comprehensive Income for the year Profit for the year Other Comprehensive Income for the year Revaluation surplus on land, net of deferred capital gain tax Total Other Comprehensive Income for the year Total Comprehensive Income for the year 21(b) 45,000 45,000 45,000 45,000 1,105,423 45,000 1,060,423 211,596 Transactions with Owners of the Company Distributions to Owners of the Company Additional shares issued Dividends declared and / or paid Total Transactions with Owners of the Company Balance as at 31 December 2020 21(a) 10 211,596 (268,158) (268,158) (268,158) 211,596 (56,562) 3,520,312 1,046,383 11,843,159 16,409,854 The above statement of changes in equity should be read in conjunction with the accompanying notes. Statement of Cash Flow For the year ended 31 December 2020 Notes Inflows/ (Outflows) 2020 ($) Inflows/ (Outflows) 2019 ($) 11,246,050 14,299,731 (7,984,112) (11,475,579) Cash flows from operating activities Receipts from customers Payments to suppliers and employees Interest paid Income taxes paid Net cash provided by operating activities (497,487) (524,393) ) 8(b) (3,288) (31,321) 2,733,130 2,296,471 (258,147) (629,624) Cash flows from Investing activities Payments for property, plant and equipment and invesment property Payments for intangible assets Proceeds from the disposal of property, plant and equipment (59,500) 16,000 (317,647) (613,624) Net cash used in investing activities Cash flows from Financing activities (258,147) (629,624) Cash flows from Investing activities Payments for property, plant and equipment and invesment property Payments for intangible assets Proceeds from the disposal of property, plant and equipment (59,500) 16,000 (317,647) (613,624) (380,000) (188,778) Net cash used in investing activities Cash flows from Financing activities Repayment of advances from related party Repayment of term loan, net Repayment of lease liabilities Dividends paid 19 (352,709) (834,211) 19 (177,292) (130,761) (56,562) (56,125) Net cash used in financing activities (966,563) (1,209,875) Net increase in cash and cash equivalents 1,448,920 472,972 (709,953) (1,182,925) Cash and cash equivalents at beginning of the year Cash and cash equivalents at the end of the year 20 738,967 (709,953) The above statement of cash flows should be read in conjunction with the accompanying notes. Notes to the Financial Statements (continued) For the year ended 31 December 2020 NOTE 19. BORROWINGS (CONTINUED) Term Loan Borrowings ($) Finance Lease Liabilities ($) Operating Lease Total ($) Liability ($) 1 Balance as at 1 January 2019 9,574,460 261,830 9,836,290 Changes from financing cash flows Repayment of borrowings (834,211) (834,211) New lease during the year 106,339 106,339 Payment of lease liabilities (117,018) (13,743) (130,761) Total 8,740,249 144,812 92,596 8,977,657 Other changes - Liability related Interest expense 405,701 11,459 2,312 419,472 Interest paid (405,701) (11,459) (2,312) (419,472) Total liability related other changes Balance at 31 December 2019 8,740,249 144,812 92,596 8,977,657 NOTE 20. THE CASH AND EQUIVALENTS Cash and cash equivalents consist of cash on hand and balance with banks net off bank overdrafts. Cash and cash equiva lents included in the statement of cash flows comprise the following statement of financial position amounts: NOTE 20. THE CASH AND EQUIVALENTS Cash and cash equivalents consist of cash on hand and balance with banks net off bank overdrafts. Cash and cash equiva lents included in the statement of cash flows comprise the following statement of financial position amounts: 2020 ($) 2019 ($) Cash on hand and at banks 738,967 299,030 Bank overdraft (Note 19) (1,008,983) Total cash and cash equivalents 738,967 (709,953) NOTE 21. SHARE CAPITAL a) Issued and Paid up Capital 2020 ($) 2019 ($) Issued and paid up Capital Balance at 1 January (6,684,500 ordinary shares) 3,308,716 3,100,000 Additional ordinary shares issued 211,596 208,716 Balance at end of the year (6,762,579 ordinary shares) 3,520,312 3,308,716 During the year, 78,079 additional shares at $2.47 per share were issued by way of a dividend reinvestment option exercised. All shares issued have equal rights. Notes to the Financial Statements (continued) For the year ended 31 December 2020 NOTE 21. SHARE CAPITAL (CONTINUED) a) Issued and Paid up Capital (Continued) The total number of shares authorized is 100,000,000. The shares have no par value. b) Asset Revaluation Reserve 2020 ($) 1,001,383 2019 ($) 1,001,383 Balance at 1 January Revaluation surplus on land, net of deferred capital gains tax 45,000 Balance at end of the year 1,046,383 1,001,383 Asset revaluation reserve relates to revaluation gains attaching to land that has not been classified as investment property. NOTE 22. RELATED PARTY DISCLOSURES a) Directors The names of persons who were directors of Pleass Global Limited at any time during the financial year are Warwick Pleass, Catherine Pleass, Ashnil Prasad, Bruce Sutton, Fomiza Feroza Bano, Latileta Qoro (Resigned on 4th June 2020) and Stephanie Jones (Appointed on 5th June 2020). a) Directors The names of persons who were directors of Pleass Global Limited at any time during the financial year are Warwick Pleass, Catherine Pleass, Ashnil Prasad, Bruce Sutton, Fomiza Feroza Bano, Latileta Qoro (Resigned on 4th June 2020) and Stephanie Jones (Appointed on 5th June 2020). b) Loan from director/shareholder 2020 ($) 2019($) i) Current liabilities 240,000 ii) Non-current liabilities 772,516 1,392,516 Total 1,012,516 1,392,516 This loan is subject to interest at 4.5%. The current liability portion of the loan from director/shareholder was determined based on the monthly repayment of $20,000 per month. c) Compensation of Key Management Personnel Key management personnel are those persons having authority and responsibility for planning, directing and controlling the activities of the entity, directly or indirectly, including any director (whether executive or otherwise) of that entity. During the year, the Managing Director, Human Resource Manager, Marketing Director and General Manager were identified as key management personnel, with the greatest authority and responsibility for the planning, directing and controlling the activities of the company. Notes to the Financial Statements (continued) For the year ended 31 December 2020 NOTE 9. EARNINGS PER SHARE Basic/diluted earnings per share is calculated by dividing net profit for the year atributable to ordinary shareholders by the weighted average number of ordinary shares outstanding during the year. 2020 ($) 2019 ($) Net profit after tax 1,060,423 673,259 Weighted average number of ordinary shares outstanding 6,762,579 6,642,223 Basic/Diluted earnings per share 0.16 0.10 2019 ($) NOTE 10. DIVIDENDS PAID OR DECLARED Details of the dividends paid or declared are: Year Cents per share 2020 Interim 2 cents 2019 Final 2 cents 2019 Interim 2 cents 2018 Final 2 cents Date declared 27-Oct-20 27-Apr-20 12-Nov-19 30-May-19 2020 ($) 134,468 133,690 132,841 132,000 264,841 268,158 PLEASS GLOBAL LIMITED 2020 ANNUAL REPORT Statement of Profit or Loss & Other Comprehensive Income For the year ended 31 December 2020 Notes Operating revenue Cost of sales 6 2020 ($) 10,996,869 (3,893,522) 2019 ($) 13,743,053 (5,462,363) Gross profit 7,103,347 8,280,690 7.1 Other revenue Operating Results 11,494 7,114,841 156,573 8,437,263 Employee benefits expense Other operating expenses 7.3 7.2 (2,032,004) (2,849,708) (2,964,795) (3,193,946) Earnings before Interest, Tax and Depreciation Allowances (EBITDA) 2,233,129 2,278,522 Depreciation and amortisation expense - Property, plant and equipment and Intangible Assets -Right-of-use assets 13,15 16 (904,232) (35,011) (968,339) (14,769) 7.4 Profit from operating activities Finance costs Profit from operations Change in fair value of investment property 1,293,886 (501,395) 792,491 370,257 1,295,414 (529,462) 765,952 14 8(a) 1,162,748 (102,325) 1,060,423 765,952 (92,693) 673,259 Profit before income tax Income tax expense Net profit for the year Other comprehensive income Items that will not be reclassified to profit or loss; - Revaluation surplus on land, net of deferred capital gain tax Other comprehensive income for the year, net of tax Total comprehensive income for the year, net of tax Earnings per share Basic/Diluted earnings per share 13,21(b) 45,000 45,000 1,105,423 673,259 0.16 0.10 The above statement of profit or loss and other comprehensive income should be read in conjunction with the accompanying notes. Statement of Financial Position As at 31 December 2020 Notes 20 11 12 2020 ($) 738,967 2,268,015 1,989,308 4,996,290 2019 ($) 299,030 2,500,291 2,549,849 5,349,170 15 13 14 Current Assets Cash on hand and at banks Trade and other receivables Inventories Total current assets Non-Current Assets Intangible assets Property, plant and equipment Investment property Right-of-use assets Total non-current assets TOTAL ASSETS Current Liabilities Trade and other payables Employee entitlements Borrowings Loan from related party Current tax liabilities Total current liabilities 133,822 14,577,384 9,000,000 54,743 23,765,949 28,762,239 84,150 15,458,180 8,600,000 91,570 24,233,900 29,583,070 16 17 18 1,823,262 178,961 1,934,910 19 1,719,586 257,741 1,466,397 240,000 60,983 3,744,707 22(b) (i) 8(b) ) 12,101 3,949,234 Non-Current Liabilities Borrowings Loan from related party 19 6,979,443 772,516 8,051,730 1,392,516 22(b)(ii) Loan from related party Current tax liabilities Total current liabilities 22(b)(0) 8(b) 240,000 60,983 3,744,707 12,101 3,949,234 Non-Current Liabilities Borrowings Loan from related party Deferred tax Total non-current liabilities TOTAL LIABILITIES NET ASSETS 19 22(b)(11) 8(c) 6,979,443 772,516 855,719 8,607,678 12,352,385 16,409,854 8,051,730 1,392,516 828,597 10,272,843 14,222,077 15,360,993 SHAREHOLDERS' EQUITY Share capital Asset revaluation reserve Retained earnings TOTAL SHAREHOLDERS' EQUITY 21(a) 21(b) 3,520,312 1,046,383 11,843,159 16,409,854 3,308,716 1,001,383 11,050,894 15,360,993 Statement of Changes in Equity For the year ended 31 December 2020 Notes Capital ($) Share Asset Revaluation Reserve ($) Retained Earnings ($) Total ($) 3,100,000 1,001,383 10,642,476 14,743,859 673,259 673,259 673,259 673,259 Balance as at 1 January 2019 Total Comprehensive Income for the year Profit for the year Total Comprehensive Income for the year Transactions with Owners of the Company Distributions to Owners of the Company Additional shares issued Dividends declared and / or paid Total Transactions with Owners of the Company Balance as at 31 December 2019 21(a) 208,716 208,716 (264,841) 10 (264,841) 208,716 (264,841) (56,125) 3,308,716 1,001,383 11,050,894 15,360,993 Total Comprehensive Income for the year Profit for the year Other Comprehensive Income for the year 1,060,423 1,060,423 1,060,423 1,060,423 Total Comprehensive Income for the year Profit for the year Other Comprehensive Income for the year Revaluation surplus on land, net of deferred capital gain tax Total Other Comprehensive Income for the year Total Comprehensive Income for the year 21(b) 45,000 45,000 45,000 45,000 1,105,423 45,000 1,060,423 211,596 Transactions with Owners of the Company Distributions to Owners of the Company Additional shares issued Dividends declared and / or paid Total Transactions with Owners of the Company Balance as at 31 December 2020 21(a) 10 211,596 (268,158) (268,158) (268,158) 211,596 (56,562) 3,520,312 1,046,383 11,843,159 16,409,854 The above statement of changes in equity should be read in conjunction with the accompanying notes. Statement of Cash Flow For the year ended 31 December 2020 Notes Inflows/ (Outflows) 2020 ($) Inflows/ (Outflows) 2019 ($) 11,246,050 14,299,731 (7,984,112) (11,475,579) Cash flows from operating activities Receipts from customers Payments to suppliers and employees Interest paid Income taxes paid Net cash provided by operating activities (497,487) (524,393) ) 8(b) (3,288) (31,321) 2,733,130 2,296,471 (258,147) (629,624) Cash flows from Investing activities Payments for property, plant and equipment and invesment property Payments for intangible assets Proceeds from the disposal of property, plant and equipment (59,500) 16,000 (317,647) (613,624) Net cash used in investing activities Cash flows from Financing activities (258,147) (629,624) Cash flows from Investing activities Payments for property, plant and equipment and invesment property Payments for intangible assets Proceeds from the disposal of property, plant and equipment (59,500) 16,000 (317,647) (613,624) (380,000) (188,778) Net cash used in investing activities Cash flows from Financing activities Repayment of advances from related party Repayment of term loan, net Repayment of lease liabilities Dividends paid 19 (352,709) (834,211) 19 (177,292) (130,761) (56,562) (56,125) Net cash used in financing activities (966,563) (1,209,875) Net increase in cash and cash equivalents 1,448,920 472,972 (709,953) (1,182,925) Cash and cash equivalents at beginning of the year Cash and cash equivalents at the end of the year 20 738,967 (709,953) The above statement of cash flows should be read in conjunction with the accompanying notes. Notes to the Financial Statements (continued) For the year ended 31 December 2020 NOTE 19. BORROWINGS (CONTINUED) Term Loan Borrowings ($) Finance Lease Liabilities ($) Operating Lease Total ($) Liability ($) 1 Balance as at 1 January 2019 9,574,460 261,830 9,836,290 Changes from financing cash flows Repayment of borrowings (834,211) (834,211) New lease during the year 106,339 106,339 Payment of lease liabilities (117,018) (13,743) (130,761) Total 8,740,249 144,812 92,596 8,977,657 Other changes - Liability related Interest expense 405,701 11,459 2,312 419,472 Interest paid (405,701) (11,459) (2,312) (419,472) Total liability related other changes Balance at 31 December 2019 8,740,249 144,812 92,596 8,977,657 NOTE 20. THE CASH AND EQUIVALENTS Cash and cash equivalents consist of cash on hand and balance with banks net off bank overdrafts. Cash and cash equiva lents included in the statement of cash flows comprise the following statement of financial position amounts: NOTE 20. THE CASH AND EQUIVALENTS Cash and cash equivalents consist of cash on hand and balance with banks net off bank overdrafts. Cash and cash equiva lents included in the statement of cash flows comprise the following statement of financial position amounts: 2020 ($) 2019 ($) Cash on hand and at banks 738,967 299,030 Bank overdraft (Note 19) (1,008,983) Total cash and cash equivalents 738,967 (709,953) NOTE 21. SHARE CAPITAL a) Issued and Paid up Capital 2020 ($) 2019 ($) Issued and paid up Capital Balance at 1 January (6,684,500 ordinary shares) 3,308,716 3,100,000 Additional ordinary shares issued 211,596 208,716 Balance at end of the year (6,762,579 ordinary shares) 3,520,312 3,308,716 During the year, 78,079 additional shares at $2.47 per share were issued by way of a dividend reinvestment option exercised. All shares issued have equal rights. Notes to the Financial Statements (continued) For the year ended 31 December 2020 NOTE 21. SHARE CAPITAL (CONTINUED) a) Issued and Paid up Capital (Continued) The total number of shares authorized is 100,000,000. The shares have no par value. b) Asset Revaluation Reserve 2020 ($) 1,001,383 2019 ($) 1,001,383 Balance at 1 January Revaluation surplus on land, net of deferred capital gains tax 45,000 Balance at end of the year 1,046,383 1,001,383 Asset revaluation reserve relates to revaluation gains attaching to land that has not been classified as investment property. NOTE 22. RELATED PARTY DISCLOSURES a) Directors The names of persons who were directors of Pleass Global Limited at any time during the financial year are Warwick Pleass, Catherine Pleass, Ashnil Prasad, Bruce Sutton, Fomiza Feroza Bano, Latileta Qoro (Resigned on 4th June 2020) and Stephanie Jones (Appointed on 5th June 2020). a) Directors The names of persons who were directors of Pleass Global Limited at any time during the financial year are Warwick Pleass, Catherine Pleass, Ashnil Prasad, Bruce Sutton, Fomiza Feroza Bano, Latileta Qoro (Resigned on 4th June 2020) and Stephanie Jones (Appointed on 5th June 2020). b) Loan from director/shareholder 2020 ($) 2019($) i) Current liabilities 240,000 ii) Non-current liabilities 772,516 1,392,516 Total 1,012,516 1,392,516 This loan is subject to interest at 4.5%. The current liability portion of the loan from director/shareholder was determined based on the monthly repayment of $20,000 per month. c) Compensation of Key Management Personnel Key management personnel are those persons having authority and responsibility for planning, directing and controlling the activities of the entity, directly or indirectly, including any director (whether executive or otherwise) of that entity. During the year, the Managing Director, Human Resource Manager, Marketing Director and General Manager were identified as key management personnel, with the greatest authority and responsibility for the planning, directing and controlling the activities of the company. Notes to the Financial Statements (continued) For the year ended 31 December 2020 NOTE 9. EARNINGS PER SHARE Basic/diluted earnings per share is calculated by dividing net profit for the year atributable to ordinary shareholders by the weighted average number of ordinary shares outstanding during the year. 2020 ($) 2019 ($) Net profit after tax 1,060,423 673,259 Weighted average number of ordinary shares outstanding 6,762,579 6,642,223 Basic/Diluted earnings per share 0.16 0.10 2019 ($) NOTE 10. DIVIDENDS PAID OR DECLARED Details of the dividends paid or declared are: Year Cents per share 2020 Interim 2 cents 2019 Final 2 cents 2019 Interim 2 cents 2018 Final 2 cents Date declared 27-Oct-20 27-Apr-20 12-Nov-19 30-May-19 2020 ($) 134,468 133,690 132,841 132,000 264,841 268,158Step by Step Solution
There are 3 Steps involved in it
Step: 1

Get Instant Access to Expert-Tailored Solutions
See step-by-step solutions with expert insights and AI powered tools for academic success
Step: 2

Step: 3

Ace Your Homework with AI
Get the answers you need in no time with our AI-driven, step-by-step assistance
Get Started


