

Question
The chart below shows the number of cappuccinos sold at the Starbucks in the Orange County airport and the Ontario, California, airport between 4 and
The chart below shows the number of cappuccinos sold at the Starbucks in the Orange County airport and the Ontario, California, airport between 4 and 5 p.m. for a week of 5 days last month.
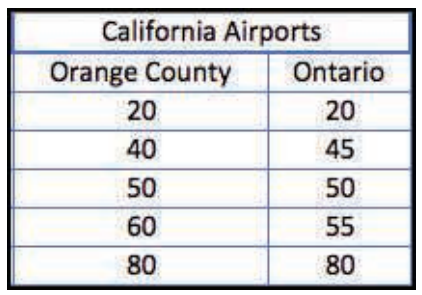
Determine the mean, median, mode, and variance for each location in that week. Comment on the similarities and differences in these measures.
California Airports Orange County Ontario 20 20 40 45 50 50 60 55 80 80Step by Step Solution
There are 3 Steps involved in it
Step: 1

Get Instant Access to Expert-Tailored Solutions
See step-by-step solutions with expert insights and AI powered tools for academic success
Step: 2

Step: 3
Ace Your Homework with AI
Get the answers you need in no time with our AI-driven, step-by-step assistance
Get Started
Analysing Financial Performance Using Integrated Ratio Analysis
Authors: Nic La Rosa
1st Edition
0367552523, 978-0367552527