

Answered step by step
Verified Expert Solution
Question
1 Approved Answer
The chart that follows has been based on the information contained in Question 2. Using the chart, draw and label the SML's complete the chart
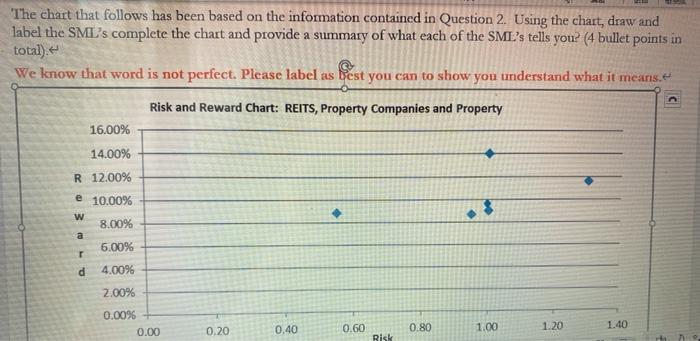 The chart that follows has been based on the information contained in Question 2. Using the chart, draw and label the SML's complete the chart and provide a summary of what each of the SMI's tells you? (4 bullet points in total). We know that word is not perfect. Please label as best you can to show you understand what it means. Risk and Reward Chart: REITS, Property Companies and Property 16.00% 14.00% R12.00% e 10.00% w 8.00% 6.00% r d 4.00% 2.00% 0.00% 0.00 0.40 0.20 0.60 0.80 1.20 1.00 1.40 Risk The chart that follows has been based on the information contained in Question 2. Using the chart, draw and label the SML's complete the chart and provide a summary of what each of the SMI's tells you? (4 bullet points in total). We know that word is not perfect. Please label as best you can to show you understand what it means. Risk and Reward Chart: REITS, Property Companies and Property 16.00% 14.00% R12.00% e 10.00% w 8.00% 6.00% r d 4.00% 2.00% 0.00% 0.00 0.40 0.20 0.60 0.80 1.20 1.00 1.40 Risk
Step by Step Solution
There are 3 Steps involved in it
Step: 1

Get Instant Access to Expert-Tailored Solutions
See step-by-step solutions with expert insights and AI powered tools for academic success
Step: 2

Step: 3
Ace Your Homework with AI
Get the answers you need in no time with our AI-driven, step-by-step assistance
Get Started
Handbook Of Research On Global Aspects Of Sustainable Finance In Times Of Crises
Authors: Ibrahim Yasar Gok
1st Edition
1799885011,1799885046