Question
The Chrysler Building in New York sold in 2019 for ~$150 million. This compares with the 2008 purchase of a 90% share by Abu Dhabi
The Chrysler Building in New York sold in 2019 for ~$150 million. This compares with the 2008 purchase of a 90% share by Abu Dhabi for $800 million. The investor lost over 80% on the deal.
This explains the loss: A third party, Cooper Union school, owns the land under the building. The annual ground rent increased in 2018 from $7.75 million to $32.5 million. Scheduled increases will bring the ground rent to $41 million in 2028 and $55 million in 2038. The lease expires in 2147.
For the purposes of this analysis, assume that your investment group wants to make an offer to buy the land, in cash, based on a discount rate of 6%. Assume that the property (land only) will be purchased on 1/1/2020 and sold on 12/31/2039, after 20 years of ownership, for $900 million. Also assume that the ground lease income stream is absolute net, with no expenses to the land owner, and that the lease rate increases all occur on January 1 of their respective years.
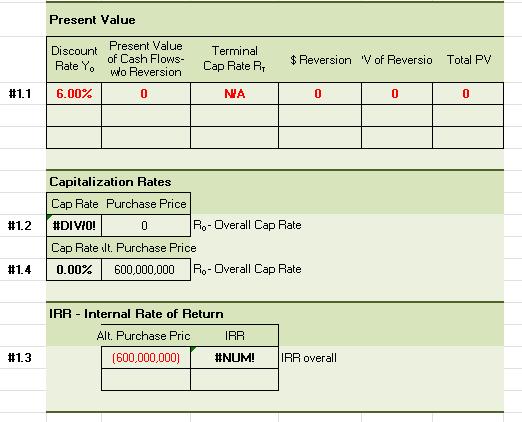
1.1 What is the Present Value based as of 1/1/2020 on a 20-year DCF?
Show calculator steps; Fill out the Excel spreadsheet
1.2 Using the PV that you found in #1, what is the Cap Rate (based on Year 1 income)?
1.3 Alternative Purchase price: If you pay $600 million for the property, what is the IRR?
1.4 Alternative Purchase price: If you pay $600 million for the property, what is the Cap Rate?

Discounted Cash Flow Analysis - Chrysler Building Ground Lease Year 1 120-12/20 Cash Flows Ground Lease Income Purchase Price Reversion Sale Cash Flow Cash Flows Ground Lease Income Purchase Price Reversion Sale Cash Flow. Year 0 0 Year 11 130-12/30 Year 2 121-12/21 0 Year 3 122-12/22 0 Year 12 Year 13 131-12/31 132-12/32 Year 4 123-12/23 0 Year 14 133-12/33 Year 5 124-12/24 0 Year 15 134-12/34 Year 6 125-12/25 0 Year 16 135-12/35 Year 7 126-12/26 0 Year 17 136-12/36 Year 8 127-12/27 0 Year 18 137-12/37 Year 9 128-12/28 0 Year 19 138-12/38 Year 10 129-12/29 0 Year 20 139-12/39 0 Year 21 140-12/40 0 0 0
Step by Step Solution
3.42 Rating (158 Votes )
There are 3 Steps involved in it
Step: 1
11 Present Value as of 112020 The cash flows for the 20 year period are as follows Year 1 32500000 Year 2 37000000 Year 3 41500000 Year 4 46000000 Yea...
Get Instant Access to Expert-Tailored Solutions
See step-by-step solutions with expert insights and AI powered tools for academic success
Step: 2

Step: 3

Ace Your Homework with AI
Get the answers you need in no time with our AI-driven, step-by-step assistance
Get Started


