Answered step by step
Verified Expert Solution
Question
1 Approved Answer
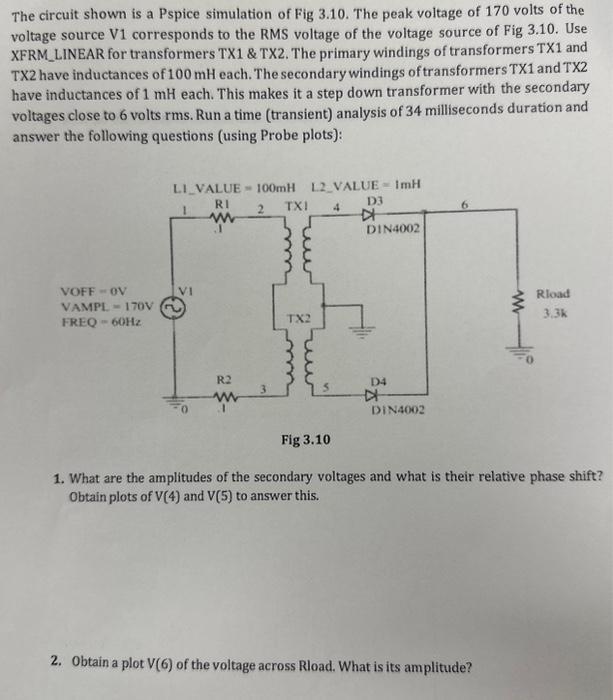
The circuit shown is a Pspice simulation of Fig 3.10. The peak voltage of 170 volts of the voltage source V1 corresponds to the

The circuit shown is a Pspice simulation of Fig 3.10. The peak voltage of 170 volts of the voltage source V1 corresponds to the RMS voltage of the voltage source of Fig 3.10. Use XFRM LINEAR for transformers TX1 & TX2. The primary windings of transformers TX1 and TX2 have inductances of 100 mH each. The secondary windings of transformers TX1 and TX2 have inductances of 1 mH each. This makes it a step down transformer with the secondary voltages close to 6 volts rms. Run a time (transient) analysis of 34 milliseconds duration and answer the following questions (using Probe plots): VOFF - OV VAMPL-170V FREQ-60Hz LI_VALUE 100mH L2 VALUE- ImH RI D3 2 TXI 4 www VI R2 3 TX2 DIN4002 D4 DIN4002 www 2. Obtain a plot V(6) of the voltage across Rload. What is its amplitude? Rload 3.3k Fig 3.10 1. What are the amplitudes of the secondary voltages and what is their relative phase shift? Obtain plots of V(4) and V(5) to answer this.
Step by Step Solution
★★★★★
3.35 Rating (155 Votes )
There are 3 Steps involved in it
Step: 1

Get Instant Access to Expert-Tailored Solutions
See step-by-step solutions with expert insights and AI powered tools for academic success
Step: 2

Step: 3

Ace Your Homework with AI
Get the answers you need in no time with our AI-driven, step-by-step assistance
Get Started


