Answered step by step
Verified Expert Solution
Question
1 Approved Answer
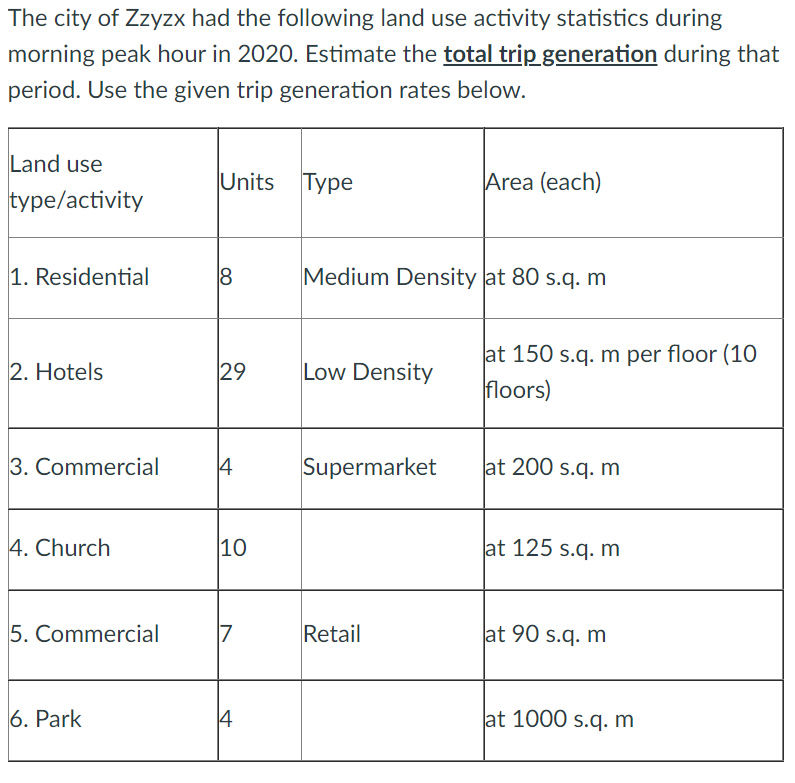
The city of Zzyzx had the following land use activity statistics during morning peak hour in 2020. Estimate the total trip generation during that


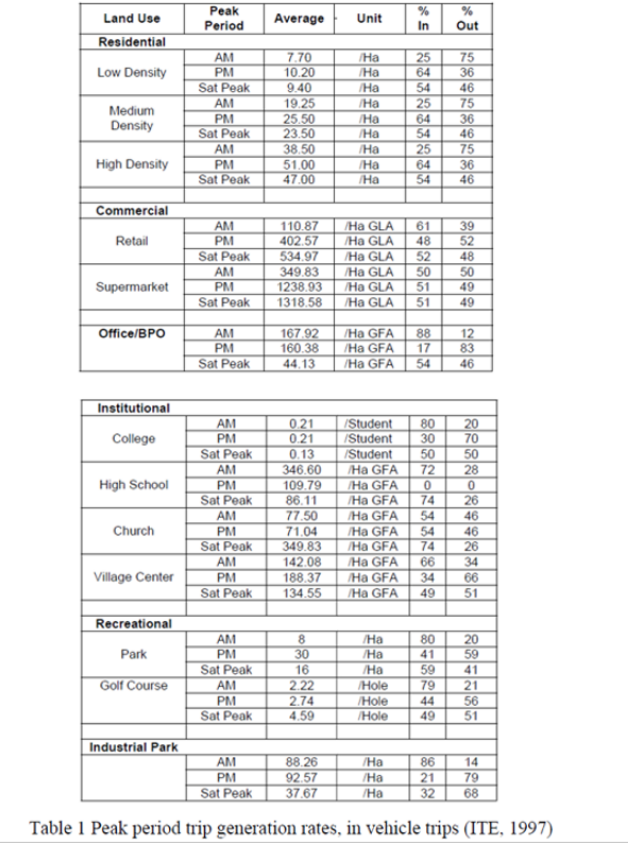
The city of Zzyzx had the following land use activity statistics during morning peak hour in 2020. Estimate the total trip generation during that period. Use the given trip generation rates below. Land use type/activity 1. Residential 2. Hotels 3. Commercial 4. Church Units Type 6. Park 18 29 14 10 5. Commercial 17 14 Medium Density at 80 s.q. m Low Density Supermarket Area (each) Retail at 150 s.q. m per floor (10 floors) at 200 s.q. m at 125 s.q. m at 90 s.q. m at 1000 s.q. m Land Use Residential Low Density Medium Density High Density Commercial Retail Supermarket Office/BPO Institutional College High School Church Village Center Recreational Park Golf Course Industrial Park Peak Period AM PM Sat Peak AM PM Sat Peak AM PM Sat Peak AM PM Sat Peak AM PM Sat Peak AM PM Sat Peak AM PM Sat Peak AM PM Sat Peak AM PM Sat Peak AM PM Sat Peak AM PM Sat Peak AM PM Sat Peak AM PM Sat Peak Average Unit 7.70 10.20 9.40 19.25 25.50 23.50 38.50 51.00 47.00 110.87 402.57 534.97 349.83 1238.93 1318.58 167.92 160.38 44.13 0.21 0.21 0.13 346.60 109.79 86.11 77.50 71.04 349.83 142.08 188.37 134.55 8 30 16 2.22 2.74 4.59 88.26 92.57 37.67 /Ha /Ha /Ha /Ha /Ha /Ha /Ha /Ha /Ha /Ha GLA /Ha GLA /Ha GLA Ha GLA /Student /Student /Student /Ha GFA /Ha GFA /Ha GFA /Ha GFA /Ha GFA /Ha GFA Ha Ha % In /Ha /Hole TIMTIMIIN /Hole /Hole 25 /Ha /Ha /Ha 64 Ha GLA /Ha GLA 48 54 25 64 54 25 64 54 61 298369 /Ha GFA 88 /Ha GFA 17 /Ha GFA 52 50 51 51 118 54 SISNIINON888 80 30 50 Ha GFA /Ha GFA /Ha GFA 49 72 74 54 54 74 66 34 80 41 59 % Out 75 36 46 75 36 46 75 36 46 39 52 48 50 49 49 12 83 46 2288-8998385 20 70 50 0 26 46 46 26 34 66 51 20 59 41 79 21 44 56 49 51 86 14 21 79 32 68 Table 1 Peak period trip generation rates, in vehicle trips (ITE, 1997)
Step by Step Solution
★★★★★
3.43 Rating (150 Votes )
There are 3 Steps involved in it
Step: 1
To estimate the total trip generation for each land use type we will use the trip generation rates provided in the second image Table 1 and apply them ...
Get Instant Access to Expert-Tailored Solutions
See step-by-step solutions with expert insights and AI powered tools for academic success
Step: 2

Step: 3

Ace Your Homework with AI
Get the answers you need in no time with our AI-driven, step-by-step assistance
Get Started


