Answered step by step
Verified Expert Solution
Question
1 Approved Answer
The Coca Cola Company and its subsidiaries' three financial statements tell a story. In order to analyze the financial health of this company and see
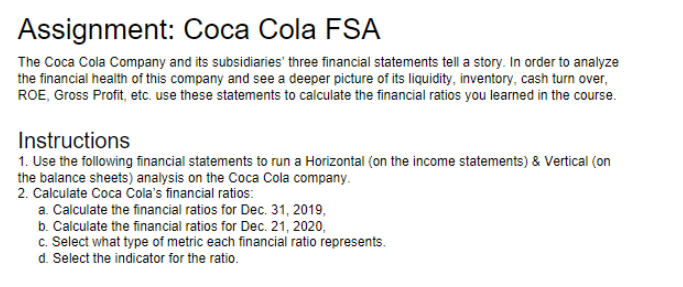
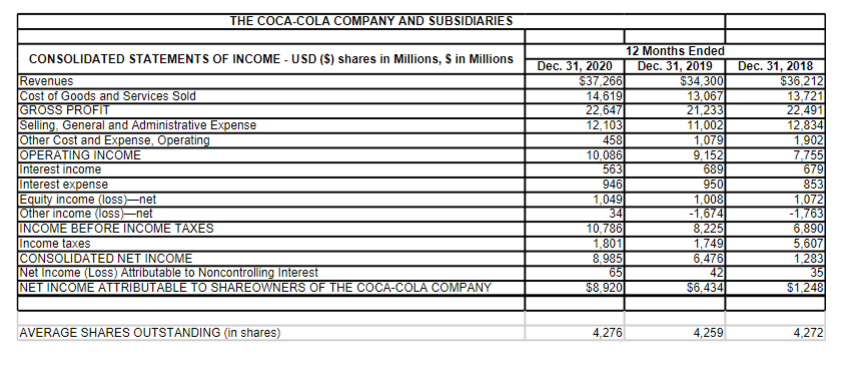
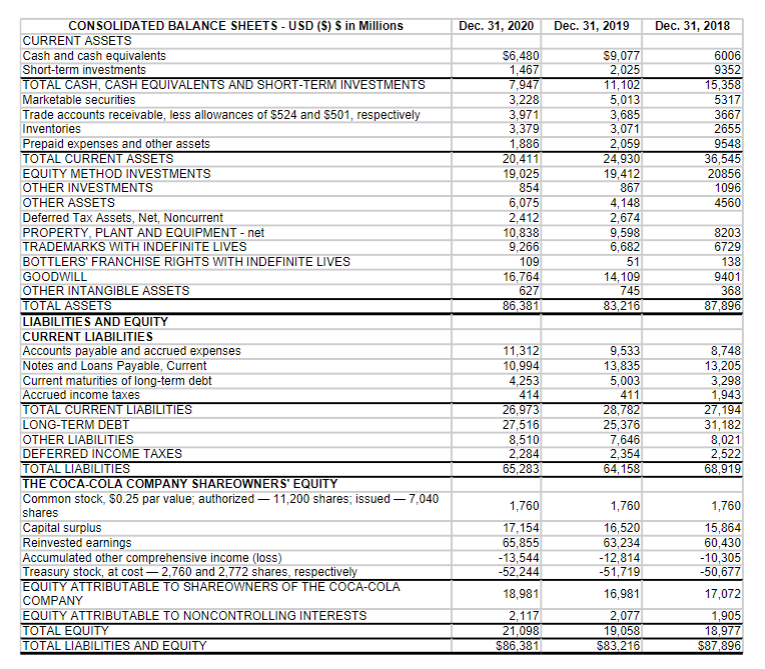
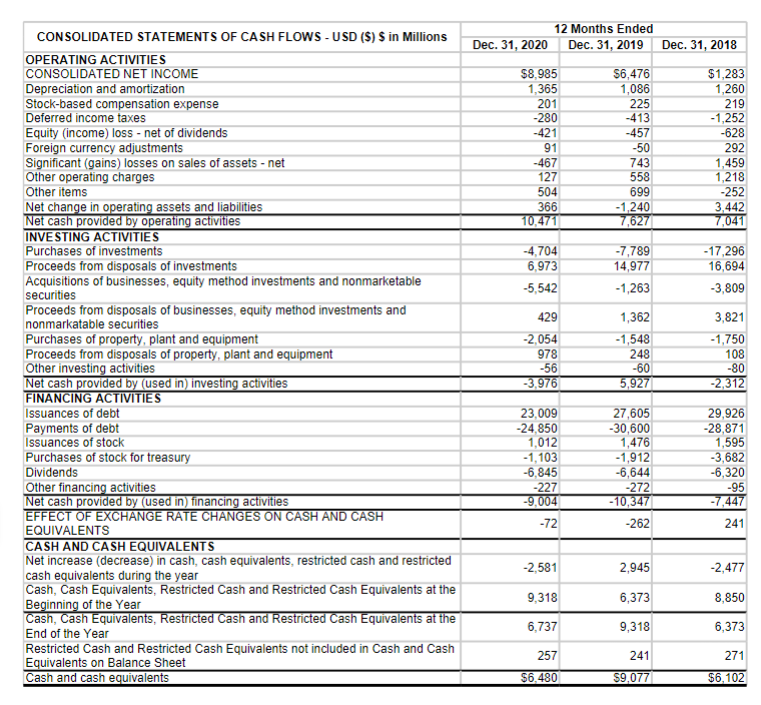
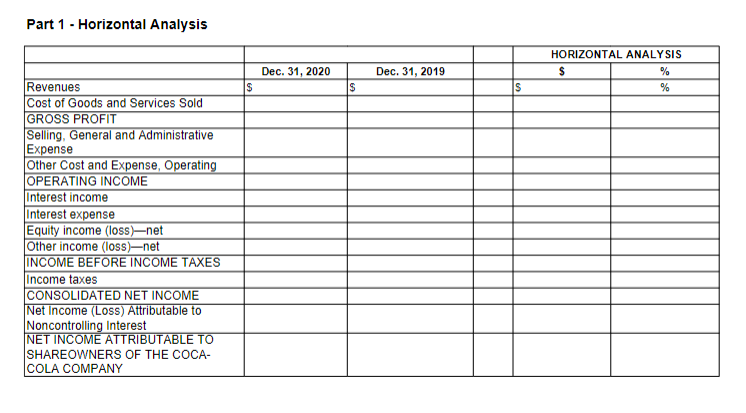
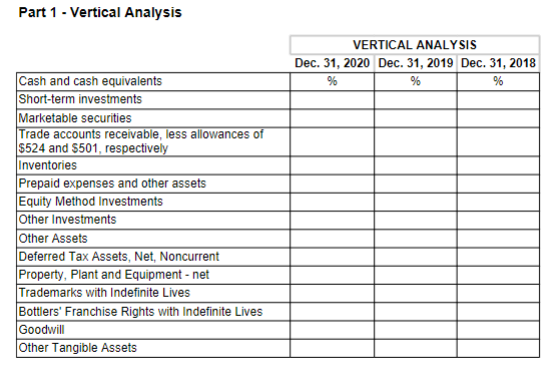
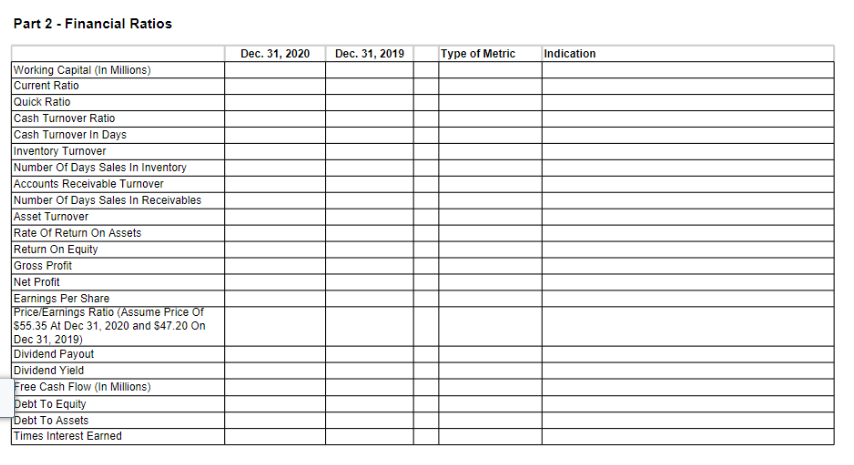 The Coca Cola Company and its subsidiaries' three financial statements tell a story. In order to analyze the financial health of this company and see a deeper picture of its liquidity, inventory, cash turn over, ROE, Gross Profit, etc. use these statements to calculate the financial ratios you learned in the course. Instructions 1. Use the following financial statements to run a Horizontal (on the income statements) \& Vertical (on the balance sheets) analysis on the Coca Cola company. 2. Calculate Coca Cola's financial ratios: a. Calculate the financial ratios for Dec. 31, 2019, b. Calculate the financial ratios for Dec. 21, 2020, c. Select what type of metric each financial ratio represents. d. Select the indicator for the ratio. \begin{tabular}{|c|c|c|c|} \hline \multicolumn{3}{|l|}{ THE COCA-COLA COMPANY AND SUBSIDIARIES } & \\ \hline \multirow{2}{*}{ CONSOLIDATED STATEMENTS OF INCOME - USD (\$) shares in Millions, S in Millions } & \multicolumn{2}{|r|}{12 Months Ended } & \\ \hline & Dec. 31,2020 & Dec. 31, 2019 & Dec. 31, 2018 \\ \hline Revenues & $37,266 & $34,300 & $36,212 \\ \hline Cost of Goods and Services Sold & 14,619 & 13,067 & 13,721 \\ \hline \begin{tabular}{|l|l|} GROSS PROFIT \\ \end{tabular} & 22,647 & 21,233 & 22,491 \\ \hline Selling, General and Administrative Expense & 12,103 & 11,002 & 12,834 \\ \hline Other Cost and Expense, Operating & 458 & 1,079 & 1,902 \\ \hline OPERATING INCOME & 10,086 & 9,152 & 7,755 \\ \hline & 563 & & 679 \\ \hline Interest expense & 946 & 950 & 853 \\ \hline Equity income (loss)-net & 1,049 & 1,008 & 1,072 \\ \hline Other income (loss)-net & 34 & 1,674 & 1,763 \\ \hline INCOME BEFORE INCOME TAXES & 10,786 & 8,225 & 6,890 \\ \hline Income taxes & 1,801 & 1,749 & 5,607 \\ \hline CONSOLIDATED NET INCOME & 8,985 & 6,476 & 1,283 \\ \hline Net Income (Loss) Attributable to Noncontrolling Interest & 65 & & 3535 \\ \hline NET INCOME ATTRIBUTABLE TO SHAREOWNERS OF THE COCA-COLA COMPANY & $8.920 & $6.434 & $1,248 \\ \hline & & & \\ \hline AVERAGE SHARES OUTSTANDING (in shares) & 4,276 & 4,259 & 4,272 \\ \hline \end{tabular} \begin{tabular}{|c|c|c|c|} \hline \multirow{2}{*}{\multicolumn{4}{|c|}{\begin{tabular}{l} CONSOLIDATED BALANCE SHEETS - USD (\$) S in Millions \\ CURRENT ASSETS \end{tabular}}} \\ \hline & & & \\ \hline Cash and cash equivalents & $6,480 & $9,077 & 6006 \\ \hline Short-term investments & 1,467 & 2,025 & 9352 \\ \hline TOTAL CASH, CASH EQUIVALENTS AND SHORT-TERM INVESTMENTS & 7,947 & 11,102 & 15,358 \\ \hline Marketable securities & 3,228 & 5,013 & 5317 \\ \hline Trade accounts receivable, less allowances of $524 and $501, respectively & 3,971 & 3,685 & 3667 \\ \hline Inventories & 3,379 & 3,071 & 2655 \\ \hline Prepaid expenses and other assets & 1,886 & 2,059 & 9548 \\ \hline TOTAL CURRENT ASSETS & 20,411 & 24,930 & 36,545 \\ \hline EQUITY METHOD INVESTMENTS & 19,025 & 19,412 & 20856 \\ \hline OTHER INVESTMENTS & 854 & 867 & 1096 \\ \hline OTHER ASSETS & 6,075 & 4,148 & 4560 \\ \hline Deferred Tax Assets, Net, Noncurrent & 2,412 & 2,674 & \\ \hline PROPERTY, PLANT AND EQUIPMENT - net & 10,838 & 9,598 & 8203 \\ \hline TRADEMARKS WITH INDEFINITE LIVES & 9,266 & 6,682 & 6729 \\ \hline BOTTLERS' FRANCHISE RIGHTS WITH INDEFINITE LIVES & 109 & 51 & 138 \\ \hline GOODWILL & 16,764 & 14,109 & 9401 \\ \hline OTHER INTANGIBLE ASSETS & 627 & 745 & 368 \\ \hline TOTAL ASSETS & 86,381 & 83,216 & 87,896 \\ \hline \multicolumn{4}{|l|}{ LIABILITIES AND EQUITY } \\ \hline \multicolumn{4}{|l|}{ CURRENT LIABILITIES } \\ \hline Accounts payable and accrued expenses & 11,312 & 9,533 & 8,748 \\ \hline Notes and Loans Payable, Current & 10,994 & 13,835 & 13,205 \\ \hline Current maturities of long-term debt & 4,253 & 5,003 & 3,298 \\ \hline Accrued income taxes & 414 & 411 & 1,943 \\ \hline TOTAL CURRENT LIABILITIES & 26,973 & 28,782 & 27,194 \\ \hline LONG-TERM DEBT & 27,516 & 25,376 & 31,182 \\ \hline OTHER LIABILITIES & 8,510 & 7,646 & 8,021 \\ \hline DEFERRED INCOME TAXES & 2,284 & 2,354 & 2,522 \\ \hline TOTAL LIABILITIES & 65,283 & 64,158 & 68,919 \\ \hline \multicolumn{4}{|l|}{ THE COCA-COLA COMPANY SHAREOWNERS' EQUITY } \\ \hline \begin{tabular}{l} Common stock, $0.25 par value; authorized 11,200 shares; issued 7,040 \\ shares \end{tabular} & 1,760 & 1,760 & 1,760 \\ \hline Capital surplus & 17,154 & 16,520 & 15,864 \\ \hline Reinvested earnings & 65,855 & 63,234 & 60,430 \\ \hline Accumulated other comprehensive income (loss) & 13,544 & 12,814 & 10,305 \\ \hline Treasury stock, at cost 2,760 and 2,772 shares, respectively & 52,244 & 51,719 & 50,677 \\ \hline \begin{tabular}{l} EQUITY ATTRIBUTABLE TO SHAREOWNERS OF THE COCA-COLA \\ COMPANY \end{tabular} & 18,981 & 16,981 & 17,072 \\ \hline EQUITY ATTRIBUTABLE TO NONCONTROLLING INTERESTS & 2,117 & 2,077 & 1,905 \\ \hline TOTAL EQUITY & 21,098 & 19,058 & 18,977 \\ \hline TOTAL LIABILITIES AND EQUITY & $86.381 & $83,216 & $87,896 \\ \hline \end{tabular} \begin{tabular}{|c|c|c|c|} \hline \multirow{2}{*}{ CONSOLIDATED STATEMENTS OF CASH FLOWS - USD (\$) $ in Millions } & \multicolumn{3}{|c|}{12 Months Ended } \\ \hline & Dec. 31,2020 & Dec. 31, 2019 & Dec. 31,2018 \\ \hline \multicolumn{4}{|l|}{ OPERATING ACTIVITIES } \\ \hline CONSOLIDATED NET INCOME & $8,985 & $6,476 & $1,283 \\ \hline Depreciation and amortization & 1,365 & 1,086 & 1,260 \\ \hline Stock-based compensation expense & 201 & 225 & 219 \\ \hline Deferred income taxes & -280 & -413 & 1,252 \\ \hline Equity (income) loss - net of dividends & -421 & -457 & -628 \\ \hline Foreign currency adjustments & 91 & -50 & 292 \\ \hline Significant (gains) losses on sales of assets - net & -467 & 743 & 1,459 \\ \hline Other operating charges & 127 & 558 & 1,218 \\ \hline Other items & 504 & 699 & -252 \\ \hline Net change in operating assets and liabilities & 366 & 1,240 & 3,442 \\ \hline Net cash provided by operating activities & 10,471 & 7,627 & 7,041 \\ \hline \multicolumn{4}{|l|}{ INVESTING ACTIVITIES } \\ \hline Purchases of investments & 4,704 & 7,789 & 17,296 \\ \hline Proceeds from disposals of investments & 6,973 & 14,977 & 16,694 \\ \hline \begin{tabular}{l} Acquisitions of businesses, equity method investments and nonmarketable \\ securities \end{tabular} & 5,542 & 1,263 & 3,809 \\ \hline \begin{tabular}{l} Proceeds from disposals of businesses, equity method investments and \\ nonmarkatable securities \end{tabular} & 429 & 1,362 & 3,821 \\ \hline Purchases of property, plant and equipment & 2,054 & 1,548 & 1,750 \\ \hline Proceeds from disposals of property, plant and equipment & 978 & 248 & 108 \\ \hline Other investing activities & -56 & -60 & -80 \\ \hline Net cash provided by (used in) investing activities & 3,976 & 5,927 & 2,312 \\ \hline \multicolumn{4}{|l|}{ FINANCING ACTIVITIES } \\ \hline Issuances of debt & 23,009 & 27,605 & 29,926 \\ \hline Payments of debt & -24.850 & 30,600 & 28,871 \\ \hline Issuances of stock & 1,012 & 1,476 & 1,595 \\ \hline Purchases of stock for treasury & 1,103 & 1,912 & 3,682 \\ \hline Dividends & 6,845 & 6,644 & 6,320 \\ \hline Other financing activities & -227 & -272 & -95 \\ \hline Net cash provided by (used in) financing activities & 9,004 & 10,347 & 7,447 \\ \hline \begin{tabular}{l} EFFECT OF EXCHANGE RATE CHANGES ON CASH AND CASH \\ EQUIVALENTS \end{tabular} & -72 & -262 & 241 \\ \hline \multicolumn{4}{|l|}{ CASH AND CASH EQUIVALENTS } \\ \hline \begin{tabular}{l} Net increase (decrease) in cash, cash equivalents, restricted cash and restricted \\ cash equivalents during the year \end{tabular} & 2,581 & 2,945 & 2,477 \\ \hline \begin{tabular}{l} Cash, Cash Equivalents, Restricted Cash and Restricted Cash Equivalents at the \\ Beginning of the Year \end{tabular} & 9,318 & 6,373 & 8,850 \\ \hline \begin{tabular}{l} Cash, Cash Equivalents, Restricted Cash and Restricted Cash Equivalents at the \\ End of the Year \end{tabular} & 6,737 & 9,318 & 6,373 \\ \hline \begin{tabular}{l} Restricted Cash and Restricted Cash Equivalents not included in Cash and Cash \\ Equivalents on Balance Sheet \end{tabular} & 257 & 241 & 271 \\ \hline Cash and cash equivalents & $6,480 & $9,077 & $6,102 \\ \hline \end{tabular} Part 1 - Horizontal Analysis Part 1 - Vertical Analysis Part 2 - Financial Ratios
 Step by Step Solution
There are 3 Steps involved in it
Step: 1

Get Instant Access to Expert-Tailored Solutions
See step-by-step solutions with expert insights and AI powered tools for academic success
Step: 2

Step: 3

Ace Your Homework with AI
Get the answers you need in no time with our AI-driven, step-by-step assistance
Get Started


