

Answered step by step
Verified Expert Solution
Question
1 Approved Answer
The code runs free of errors but always gives Nan correlation. i dont understand what the problem is , i tried every solution but keeps
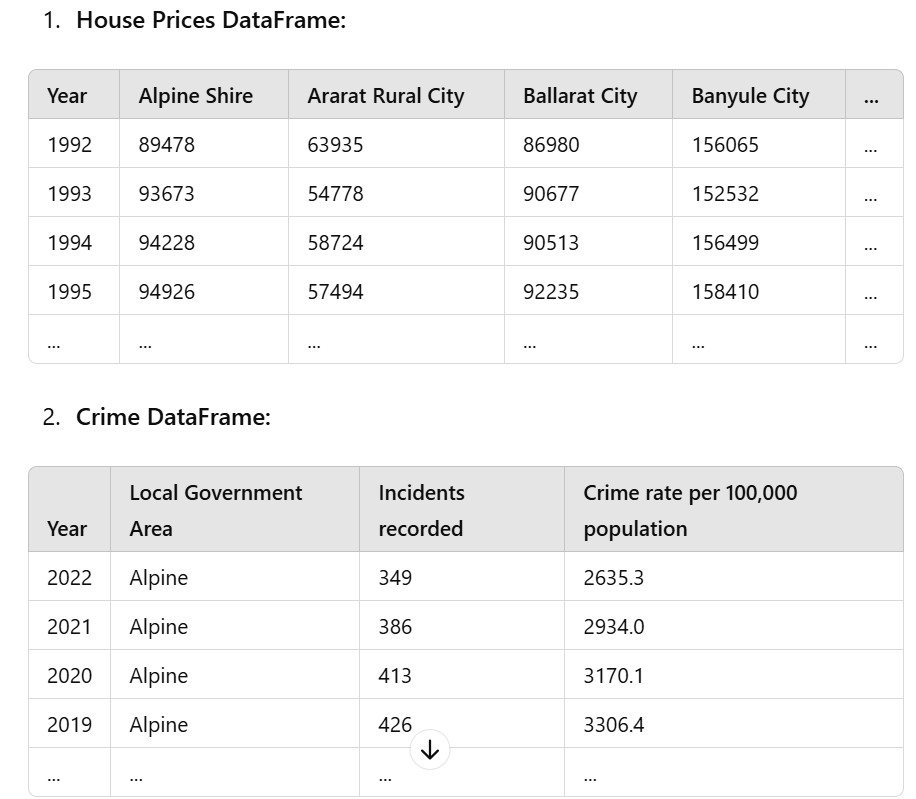
The code runs free of errors but always gives Nan correlation. i dont understand what the problem is i tried every solution but keeps producing same output. i have attached the datasets i have to make the code and create a correlation for the four hupothesis and even attach the result. my data frame is always empty no matter how i edit the code. there is no null values or string values in my data set as well help me and give me a code free of error and give me right correlation. removing rows, merging, eberything is done but still gives Nan correlation. give the correct code, no need for explanation if the code still gives Nan output.
import pandas as pd
import numpy as np
from scipy.stats import pearsonr
import matplotlib.pyplot as plt
# Read data files
housepricesdf pdreadexcelMeanHousePricesCleanxlsx
crimedf pdreadexcelCrimeCleanxlsx
populationdf pdreadexcelPopulationCleanxlsx
areadf pdreadexcelSuburbAreasxlsx headerNone
# Step B: Clean and prepare data
def preparedatadf columns:
df dfdropnasubsetcolumns # Remove rows with missing values in key columns
return df
# Rename columns for consistency
housepricesdf housepricesdfrenamecolumnsYear: 'year'
crimedf crimedfrenamecolumnsYear: 'year', 'Crime rate per population': 'crimerate',
'Local Government Area': 'localgovernmentarea'
populationdf populationdfrenamecolumnsYear: 'year'
areadf areadfrenamecolumns: 'localgovernmentarea', : 'area'
# Clean the area DataFrame to remove nonrelevant rows
areadf areadfareadflocalgovernmentarea' 'Property'
# Step C: Analysis functions
def analyzecorrelationdf col col:
df dfdropnasubsetcol col
if lendf:
return npnan
correlation, pearsonrdfcol dfcol
return correlation
# Reshape data to long format
housepriceslong pdmelthousepricesdf idvarsyear varname'localgovernmentarea', valuename'meanhouseprice'
populationlong pdmeltpopulationdf idvarsyear varname'localgovernmentarea', valuename'population'
# Merge the datasets on 'year' and 'localgovernmentarea'
mergeddf pdmergecrimedf housepriceslong, onyear 'localgovernmentarea' how'inner'
mergeddf pdmergemergeddf populationlong, onyear 'localgovernmentarea' how'inner'
mergeddf pdmergemergeddf arealong, on'localgovernmentarea', how'inner'
# Calculate population density
mergeddfpopulationdensity' mergeddfpopulation mergeddfarea
# Step D: Prepare the data by cleaning
mergeddf preparedatamergeddfmeanhouseprice', 'crimerate', 'populationdensity'
# Step E: Perform correlation analysis
housepricepopulationcorr analyzecorrelationmergeddf 'meanhouseprice', 'populationdensity'
crimehousepricecorr analyzecorrelationmergeddf 'crimerate', 'meanhouseprice'
crimepopulationdensitycorr analyzecorrelationmergeddf 'crimerate', 'populationdensity'
# Step F: Print the results
printfCorrelation between house prices and population density: housepricepopulationcorr
printfCorrelation between crime rate and house prices: crimehousepricecorr
printfCorrelation between crime rate and population density: crimepopulationdensitycorr
# Plotting for visual analysis
pltfigurefigsize
pltscattermergeddfpopulationdensity' mergeddfmeanhouseprice'
plttitleHouse Price vs Population Density'
pltxlabelPopulation Density people per square km
pltylabelMean House Price'
pltgridTrue
pltshow
pltfigurefigsize
pltscattermergeddfmeanhouseprice' mergeddfcrimerate'
plttitleCrime Rate vs House Price'
pltxlabelMean House Price'
pltylabelCrime Rate per population
pltgridTrue
pltshow
pltfigurefigsize
pltscattermergeddfpopulationdensity' mergeddfcrimerate'
plttitleCrime Rate vs Population Density'
pltxlabelPopulation Density people per square km
pltylabelCrime Rate per population
pltgridTrue
pltshow
output the above code gives: Correlation between house prices and population density: nan
Correlation between crime rate and house prices: nan
Correlation between crime rate and population density: nan
problem: Empty DataFrame
Columns: Incidents recorded, crimerate, meanhouseprice, year, population, localgovernmentarea, area, populationdensity
Index:
Step by Step Solution
There are 3 Steps involved in it
Step: 1

Get Instant Access to Expert-Tailored Solutions
See step-by-step solutions with expert insights and AI powered tools for academic success
Step: 2

Step: 3
Ace Your Homework with AI
Get the answers you need in no time with our AI-driven, step-by-step assistance
Get Started
Big Data Concepts, Theories, And Applications
Authors: Shui Yu, Song Guo
1st Edition
3319277634, 9783319277639