

Answered step by step
Verified Expert Solution
Question
1 Approved Answer
The company will br represented as company X who sales solar panels. The company's expected income for 2020 is $280,000, for the year 2021 the
The company will br represented as company "X" who sales solar panels. The company's expected income for 2020 is $280,000, for the year 2021 the expected income is $340,000 and 2022 the expected income is $450,000. I am having a hard time creating an excel sheet that includes sales forcast, expense forecast, and break-even (cost of goods). If someone can create a mock-up spreadsheet that I can follow it will aid in my understanding!
The goal of this project is to test student understanding of financial assessments. The purpose of this portion is to create an excel worksheet that includes forecast sales, forecast expenses and break even. The excel sheet can include anything related to solar panels for example forecast expenses can include advertising cost, credit card fees, etc. I need help on how to set up this sheet as I have created an estimated revenue for the first year (2020) to be $280,000, (2021) $340,000 and (2022) $450,000. The excel sheet should reflect the incoming earnings above. The company will start with $100,000 and make $280,000 within the first year which is $180,000 profit. If you need any other information please let me know. You have freedom to control pricing as long as it reflects the income above. Here is what I have so far but I am not sure it makes any sense with expected revenue. 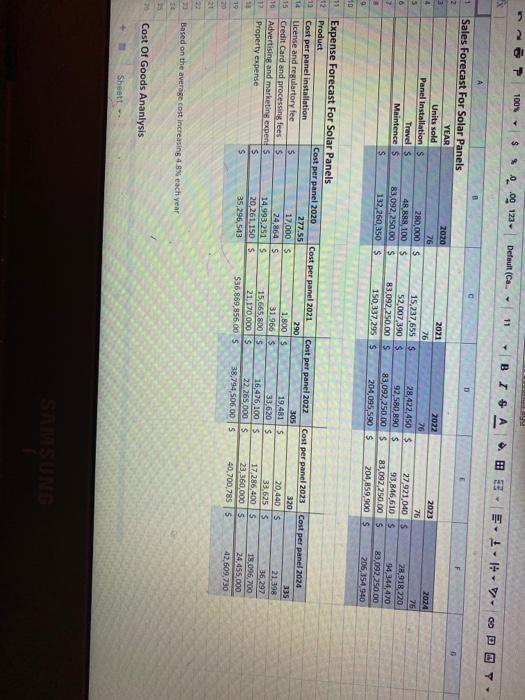
Part IV: Financial Assessment Summarize the company's budget, schedule and monitoring in a spreadsheet, and include comments. Sales Forecast Include a breakdown by product, segment, and region, it applicable. Expense Forecast . Include a breakdown by partner, segment, and region, if applicable. Marketing Expenditures Alignment with Strategy and Tactics List strategy/tactics along with related expe itures. Explain the return on investment for marketing expenditures. Break-Even Analysis Create a "Cost of Goods" estimate and determine the revenue required for break even. 100% $ 0.00 123 Default (Ca. 11 BIA 4. 3 - F.I. y 1 D 2 2 4 Sales Forecast for Solar Panels YEAR Units sold Panel Installations Travels Maintences S 2020 76 280,000 $ 48 888 100 $ 83092,250.00 $ 132.260 350 S 6 7 2021 26 15,237,655 $ 52,007,390 83,092 250.00 S 150,337,295 $ 2022 76 28.422,450 $ 92,580,890 S 83,092.250.00 204,095,590 $ 2023 76 27921,040 93,846,610 $ 83 092,250.00 $ 204 859,900 $ 2024 76 28 918 220 94344470 80.092 250.00 206,354940 10 11 12 13 15 16 12 18 19 Expense Forecast for Solar Panels Product Cost per panel 2020 Cost per panel 2021 Cost per panel 2022 Cost per panel 2023 Cost per panel 2024 Cost per panel installation 277.55 290 305 320 License and regulartory fee 335 5 17.000 1,800S 19 4815 20,4405 21 398 Credit Card and processing fees $ 24,8645 31 966 $ 33 620S 33,6255 36 297 Advertising and marketing experts 14 993,2515 15,665,800 16,476, 100$ 17 286,400 18.096,700 Property expense $ 20.261.150S 21.170.000 22.265.000 $ 23,360,000 $ 24 455,000 $ 35,296,543 $36,869,856,00 S 38,794 506.005 40.700.7855 42.609,730 22 Based on the average cost increasing 49% each year Cost Of Goods Ananlysis Sheett Part IV: Financial Assessment Summarize the company's budget, schedule and monitoring in a spreadsheet, and include comments. Sales Forecast Include a breakdown by product, segment, and region, it applicable. Expense Forecast . Include a breakdown by partner, segment, and region, if applicable. Marketing Expenditures Alignment with Strategy and Tactics List strategy/tactics along with related expe itures. Explain the return on investment for marketing expenditures. Break-Even Analysis Create a "Cost of Goods" estimate and determine the revenue required for break even. 100% $ 0.00 123 Default (Ca. 11 BIA 4. 3 - F.I. y 1 D 2 2 4 Sales Forecast for Solar Panels YEAR Units sold Panel Installations Travels Maintences S 2020 76 280,000 $ 48 888 100 $ 83092,250.00 $ 132.260 350 S 6 7 2021 26 15,237,655 $ 52,007,390 83,092 250.00 S 150,337,295 $ 2022 76 28.422,450 $ 92,580,890 S 83,092.250.00 204,095,590 $ 2023 76 27921,040 93,846,610 $ 83 092,250.00 $ 204 859,900 $ 2024 76 28 918 220 94344470 80.092 250.00 206,354940 10 11 12 13 15 16 12 18 19 Expense Forecast for Solar Panels Product Cost per panel 2020 Cost per panel 2021 Cost per panel 2022 Cost per panel 2023 Cost per panel 2024 Cost per panel installation 277.55 290 305 320 License and regulartory fee 335 5 17.000 1,800S 19 4815 20,4405 21 398 Credit Card and processing fees $ 24,8645 31 966 $ 33 620S 33,6255 36 297 Advertising and marketing experts 14 993,2515 15,665,800 16,476, 100$ 17 286,400 18.096,700 Property expense $ 20.261.150S 21.170.000 22.265.000 $ 23,360,000 $ 24 455,000 $ 35,296,543 $36,869,856,00 S 38,794 506.005 40.700.7855 42.609,730 22 Based on the average cost increasing 49% each year Cost Of Goods Ananlysis Sheett Step by Step Solution
There are 3 Steps involved in it
Step: 1

Get Instant Access to Expert-Tailored Solutions
See step-by-step solutions with expert insights and AI powered tools for academic success
Step: 2

Step: 3
Ace Your Homework with AI
Get the answers you need in no time with our AI-driven, step-by-step assistance
Get Started
The Nft Guide Learn How To Buy Sell Collect And Mint Non Fungible Tokens
Authors: Thomas Jase
1st Edition