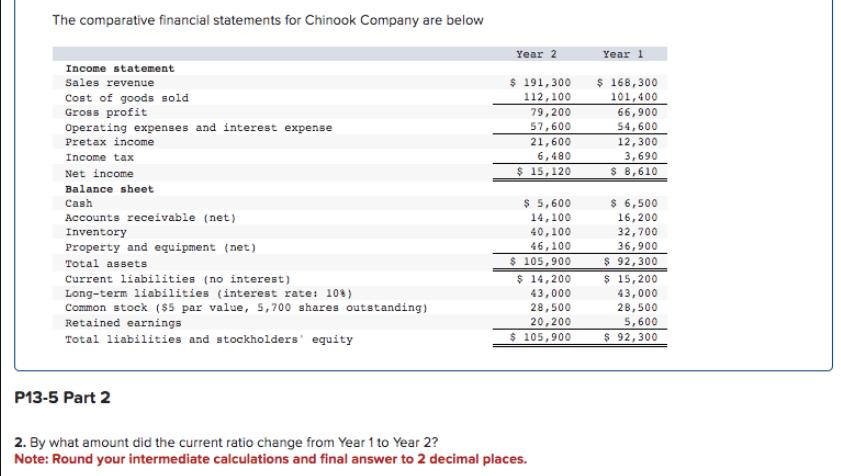
The comparative financial statements for Chinook Company are below Income statement Sales revenue Cost of goods sold Gross profit Operating expenses and interest expense

The comparative financial statements for Chinook Company are below Income statement Sales revenue Cost of goods sold Gross profit Operating expenses and interest expense Pretax income Income tax Net income Cash Balance sheet Accounts receivable (net) Inventory Property and equipment (net) Total assets Current liabilities (no interest) Long-term liabilities (interest rate: 10%) Common stock ($5 par value, 5,700 shares outstanding) Retained earnings Total liabilities and stockholders' equity Year 2 Year 1 $ 191,300 112,100 $ 168,300 101,400 79,200 66,900 57,600 54,600 21,600 12,300 6,480 3,690 $ 15,120 $ 5,600 14,100 40,100 46,100 $ 105,900 $ 14,200 43,000 28,500 $ 8,610 $ 6,500 16,200 32,700 36,900 $92,300 $ 15,200 43,000 28,500 20,200 5,600 $ 105,900 $92,300 P13-5 Part 2 2. By what amount did the current ratio change from Year 1 to Year 2? Note: Round your intermediate calculations and final answer to 2 decimal places.
Step by Step Solution
There are 3 Steps involved in it
Step: 1
1 Calculating Current Ratios for Year 1 and Year 2 Year 1 Current Assets Cash 5600 ...
See step-by-step solutions with expert insights and AI powered tools for academic success
Step: 2

Step: 3

Ace Your Homework with AI
Get the answers you need in no time with our AI-driven, step-by-step assistance
Get Started


