

Answered step by step
Verified Expert Solution
Question
1 Approved Answer
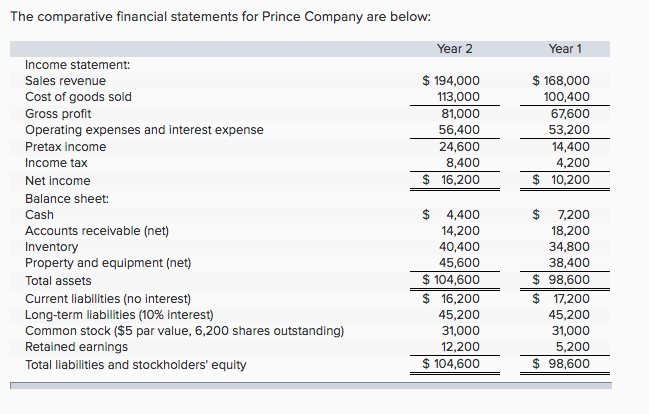
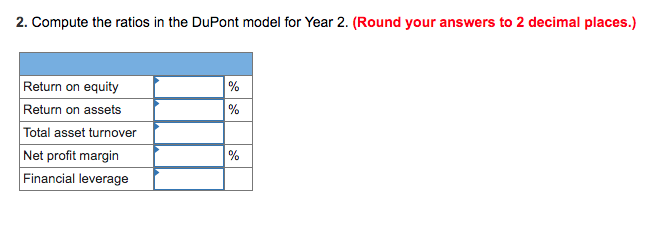
The comparative financial statements for Prince Company are below: Year 1 Year 2 Income statement: Sales revenue Cost of goods sold Gross profit Operating expenses
Step by Step Solution
There are 3 Steps involved in it
Step: 1

Get Instant Access to Expert-Tailored Solutions
See step-by-step solutions with expert insights and AI powered tools for academic success
Step: 2

Step: 3
Ace Your Homework with AI
Get the answers you need in no time with our AI-driven, step-by-step assistance
Get Started
Managerial Accounting Method And Meaning Teachers Guide
Authors: R.M.S. Wilson
2nd Edition
0412436205, 978-0412436208