

Answered step by step
Verified Expert Solution
Question
1 Approved Answer
The comparative financial statements prepared at December 31, for Carpenter Inc. showed the following summarized data: 2021 2020 Income Statement Sales revenue Cost of goods
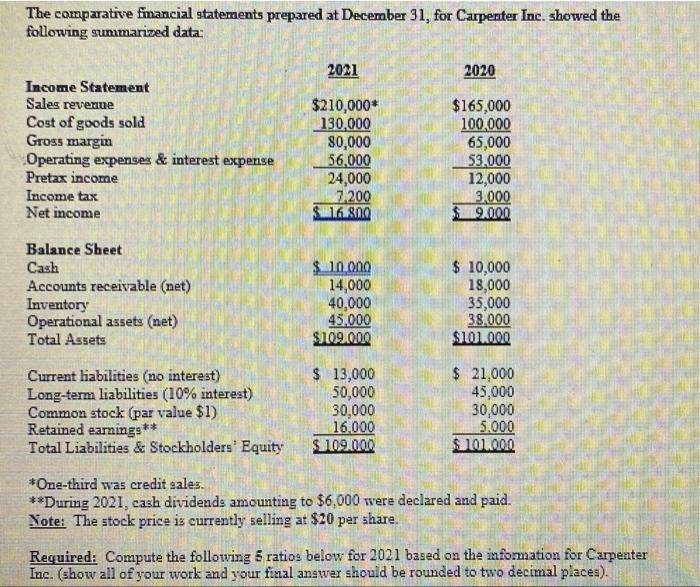
 The comparative financial statements prepared at December 31, for Carpenter Inc. showed the following summarized data: 2021 2020 Income Statement Sales revenue Cost of goods sold Gross margin Operating expenses & interest expense Pretax income Income tax Net income $210,000+ 130,000 80,000 56,000 24,000 7.200 16.800 $165,000 100,000 65,000 53,000 12,000 3,000 $9.000 Balance Sheet Cash Accounts receivable (net) Inventory Operational assets (net) Total Assets $ 10.000 14,000 40,000 45,000 $109.000 $ 10,000 18,000 35,000 38.000 $10.000 Current liabilities (no interest) Long-term liabilities (10% interest) Common stock (par value $1) Retained earnings *** Total Liabilities & Stockholders' Equity $ 13,000 50,000 30,000 16.000 $109.000 $ 21,000 45,000 30,000 5.000 $10.000 *One-third was credit sales. **During 2021, cash dividends amounting to $6,000 were declared and paid. Note: The stock price is currently selling at $20 per share. Required: Compute the following 6 ratios below for 2021 based on the information for Carpenter Inc. (show all of your work and your final answer should be rounded to two decimal places). Return on Assets Earnings per Share Profit Margin Current Ratio Times Interest Earned
Step by Step Solution
There are 3 Steps involved in it
Step: 1

Get Instant Access to Expert-Tailored Solutions
See step-by-step solutions with expert insights and AI powered tools for academic success
Step: 2

Step: 3
Ace Your Homework with AI
Get the answers you need in no time with our AI-driven, step-by-step assistance
Get Started
Handbook Of Consumer Finance Research
Authors: Jing Jian Xiao
2nd Edition
3319288857, 978-3319288857