Answered step by step
Verified Expert Solution
Link Copied!

Question

1 Approved Answer

The comparative income statements and additional data for Harmon Decor, Inc., follow: (Click the icon to view the comparative income statements.) B (Click the icon

image text in transcribedimage text in transcribed

The comparative income statements and additional data for Harmon Decor, Inc., follow: (Click the icon to view the comparative income statements.) B (Click the icon to view the additional data.) Read the requirement Select the formula for each of the following component ratios, then calculate the ratios for 2018 and 2017. (Round ALL of your answ n your analysis.) Ratio Formula 2018 2017 ROS AT ROA L ROE Harmon Decor, Inc. Comparative Income Statements Years Ended December 31, 2018 and 2017 2018 2017 Net sales $ 190,000 $ 240,000 Cost of goods sold 102.000 134,000 Gross profit 88,000 106,000 Selling and general expenses 44,000 49,000 Income from operations 44,000 57,000 9.000 Interest expense 7,000 Income before income tax 35,000 50,000 Income tax expense 12,000 16,000 $ 23,000 $ 34,000 Net income X i Data Table Total assets....... ......... $ Common stockholders' equity ..........$ Preferred dividends .................$ Average common shares outstanding during the year ............... 2018 300,000 $ 104,000 $ 15,000 $ 2017 270,000 $ 103,000 $ 14,000 $ 2016 250,000 102,000 3,000 Print Done 24,000 23,000 22,000 Choose from any list or enter any ny Print Done E 12-34B (similar to) Data Table - X The comparative income statements and additional data for Harmon Decor, Inc., follow: (Click the icon to view the comparative income statements.) (Click the icon to view the additional data.) Read the requirement bense Select the formula for each of the following component ratios, then calculate the ratios for 2018 and 2017. (Round ALL of your ansv in your analysis.) Ratio Formula 2018 2017 ROS AT Harmon Decor, Inc. Comparative Income Statements Years Ended December 31, 2018 and 2017 2018 2017 Net sales $ 190,000 S 240,000 Cost of goods sold 102.000 134,000 Gross profit 88,000 106,000 Selling and general expenses 44,000 49,000 Income from operations 44.000 57,000 9,000 Interest expense 7,000 Income before income tax 35,000 50,000 Income tax expense 12,000 16,000 Net income $ 23.000 S 34,000 ROA Print Done

Step by Step Solution

There are 3 Steps involved in it

Step: 1

blur-text-image

Get Instant Access to Expert-Tailored Solutions

See step-by-step solutions with expert insights and AI powered tools for academic success

Step: 2

blur-text-image_2

Step: 3

blur-text-image_3

Ace Your Homework with AI

Get the answers you need in no time with our AI-driven, step-by-step assistance

Get Started

Recommended Textbook for

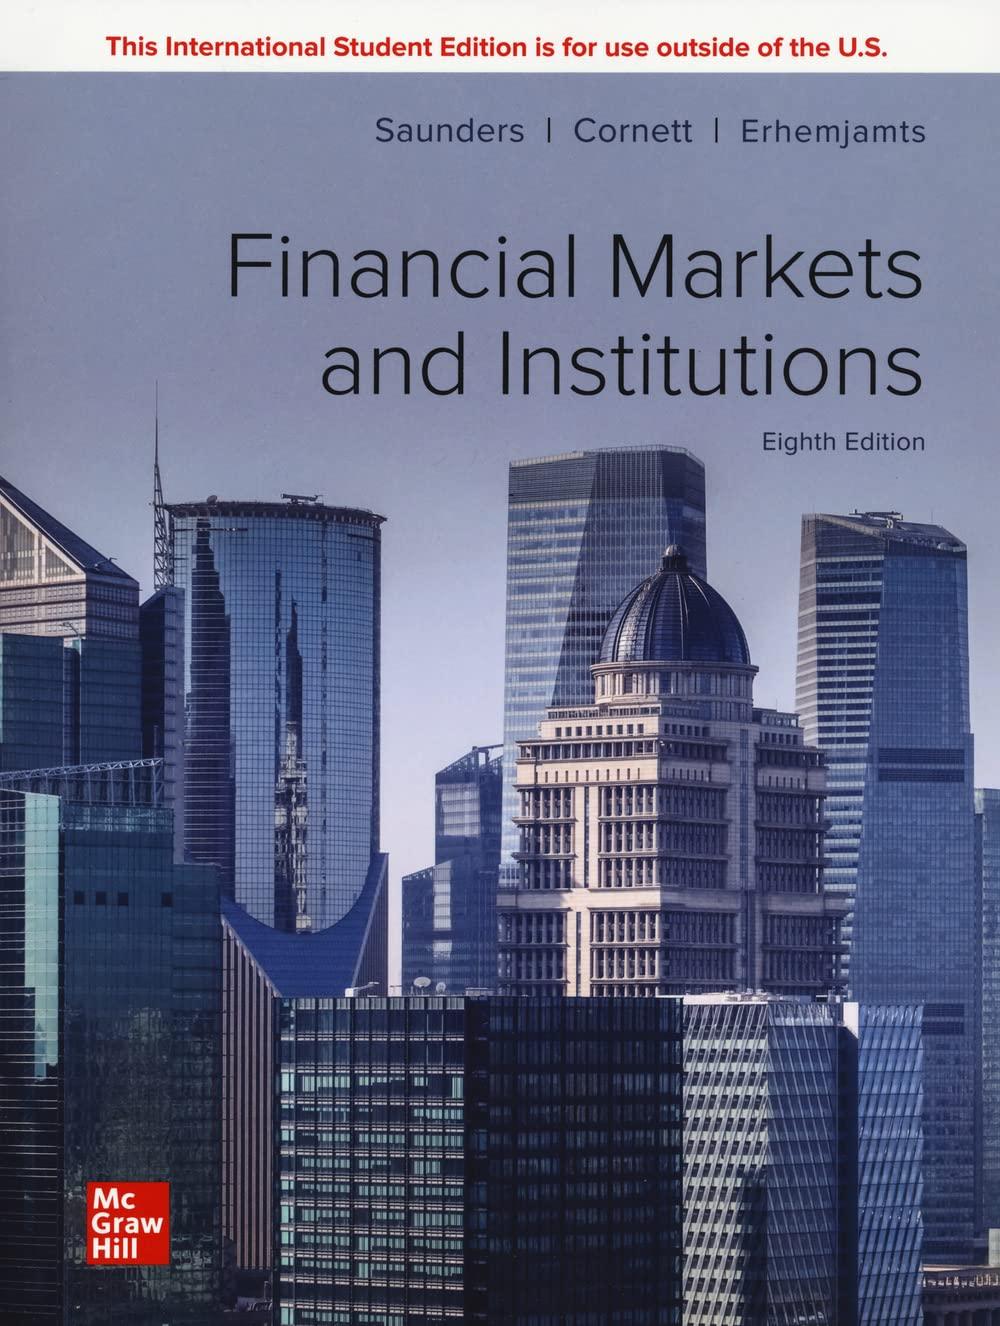
ISE Financial Markets And Institutions

Authors: Anthony Saunders, Marcia Cornett, Otgo Erhemjamts

8th International Edition

1265561435, 9781265561437

More Books

Students also viewed these Finance questions

Question

Give the reliability function of the structure of Exercise 8.

Answered: 1 week ago

Question

How do patients across cultures prefer to make medical decisions?

Answered: 1 week ago