

Answered step by step
Verified Expert Solution
Question
1 Approved Answer
The comparative statements of Bridgeport Interiors Ltd. are presented as follows: BRIDGEPORT INTERIORS LTD. Income Statement For the Year Ended December 31 2021 2020 Net
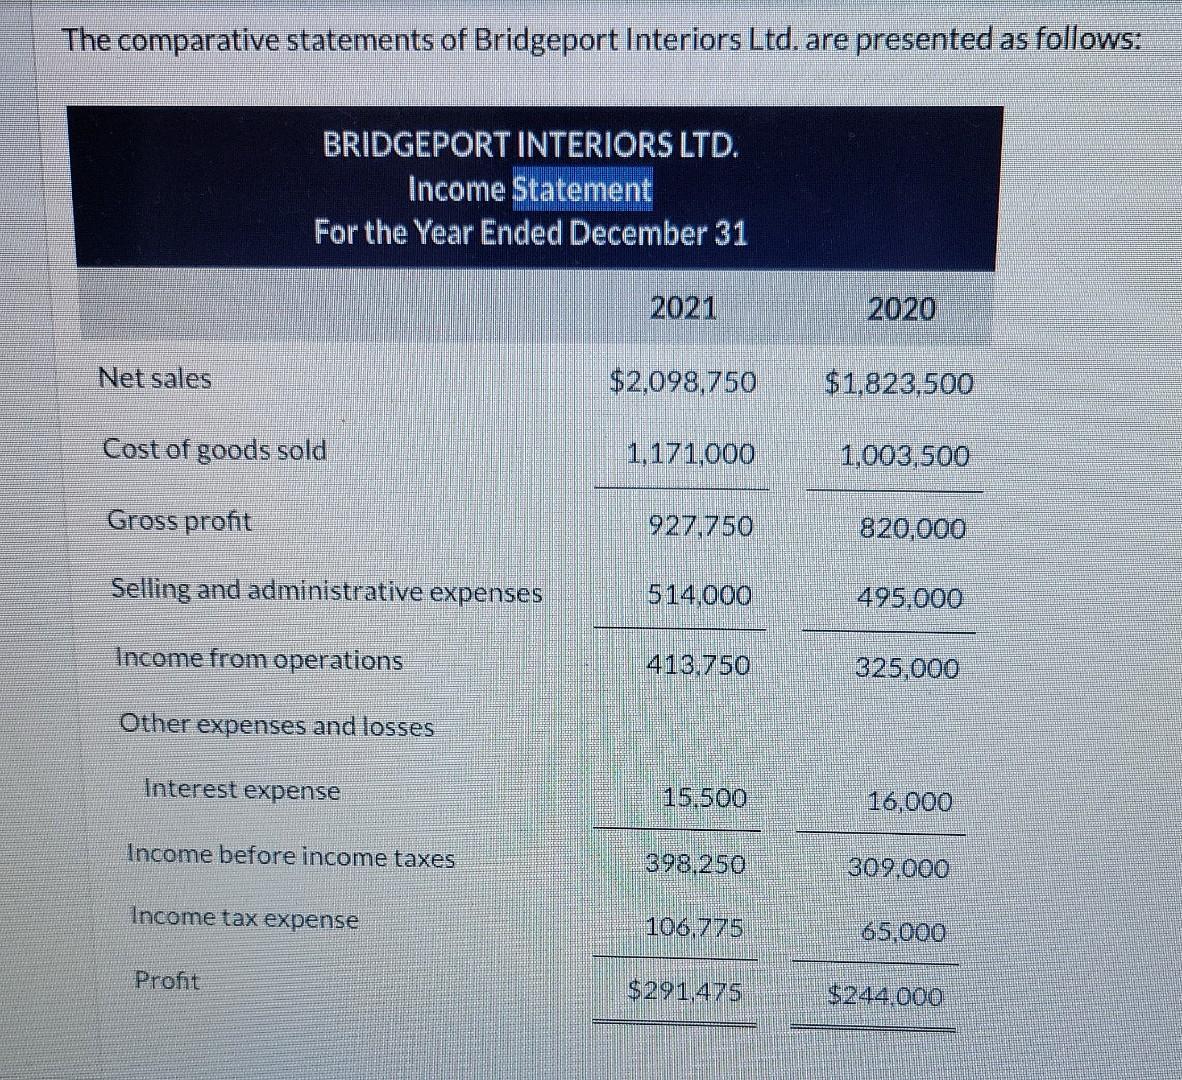
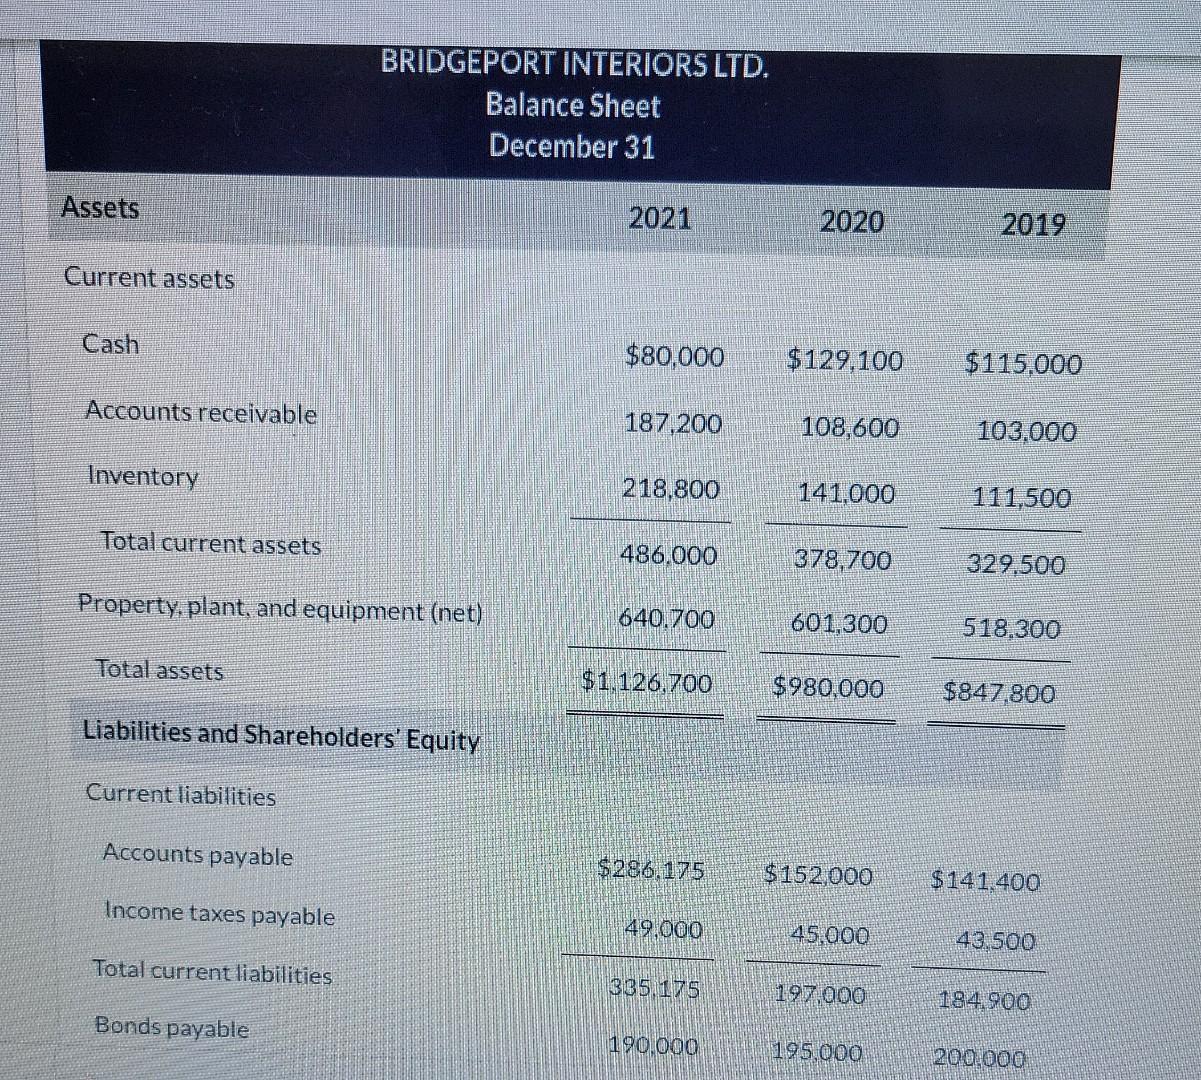
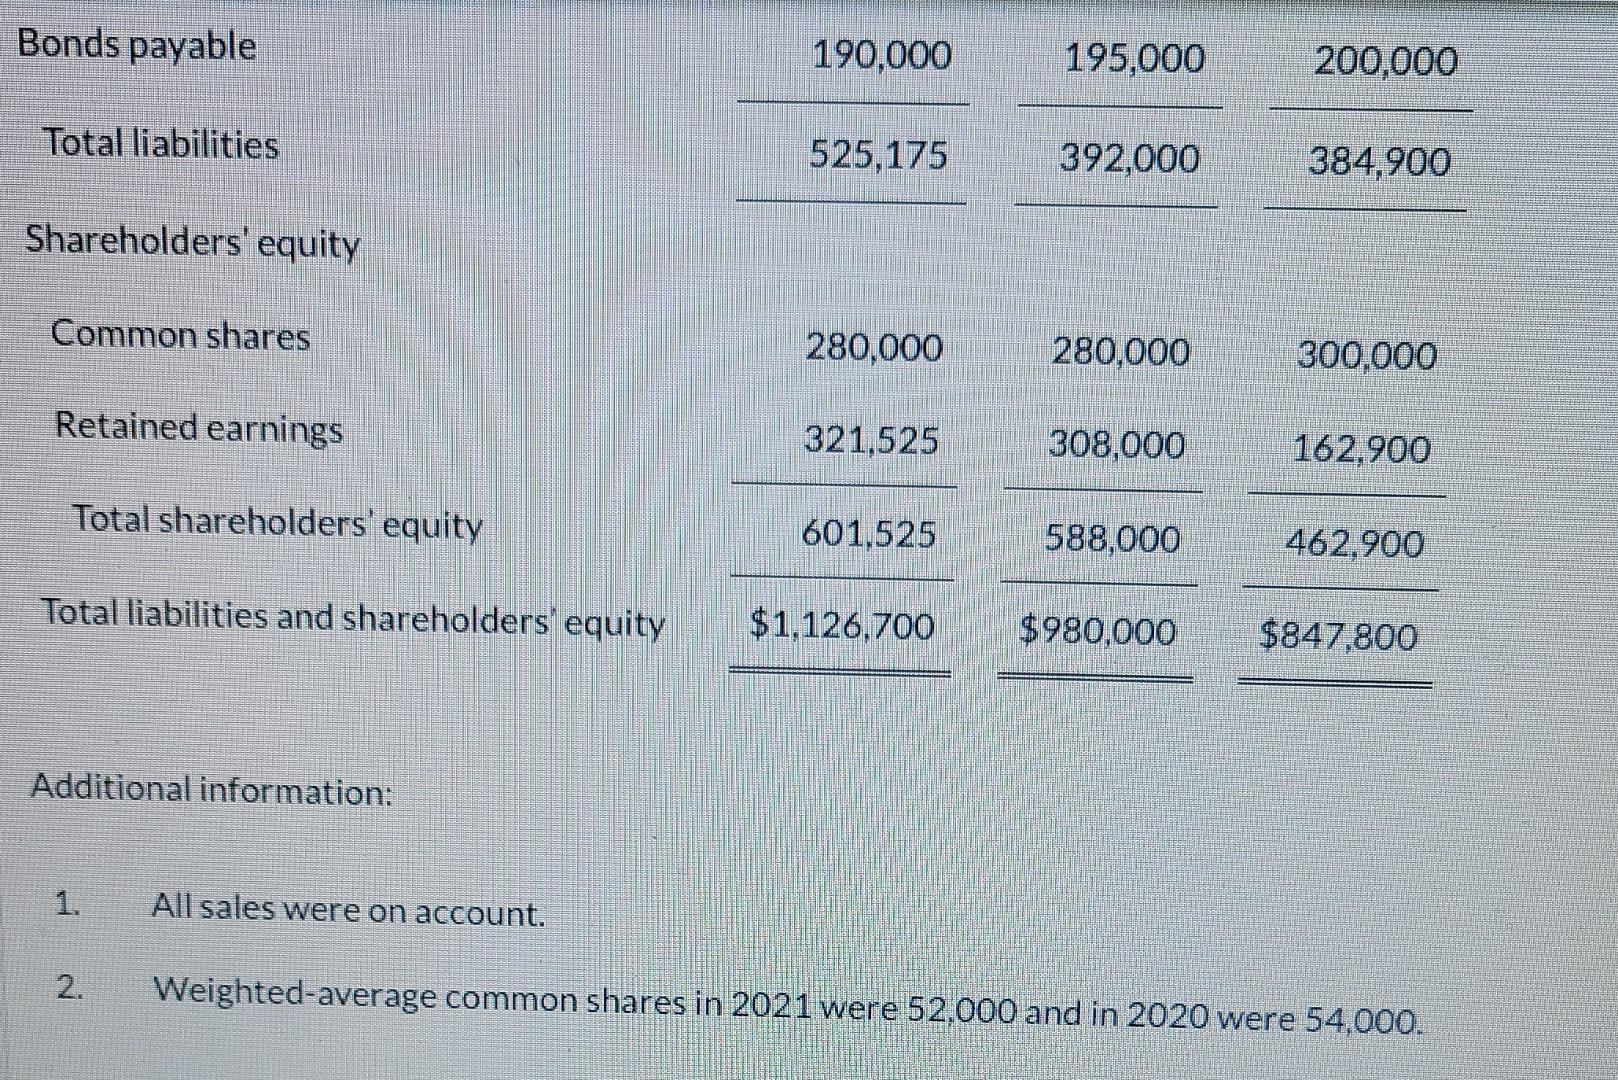
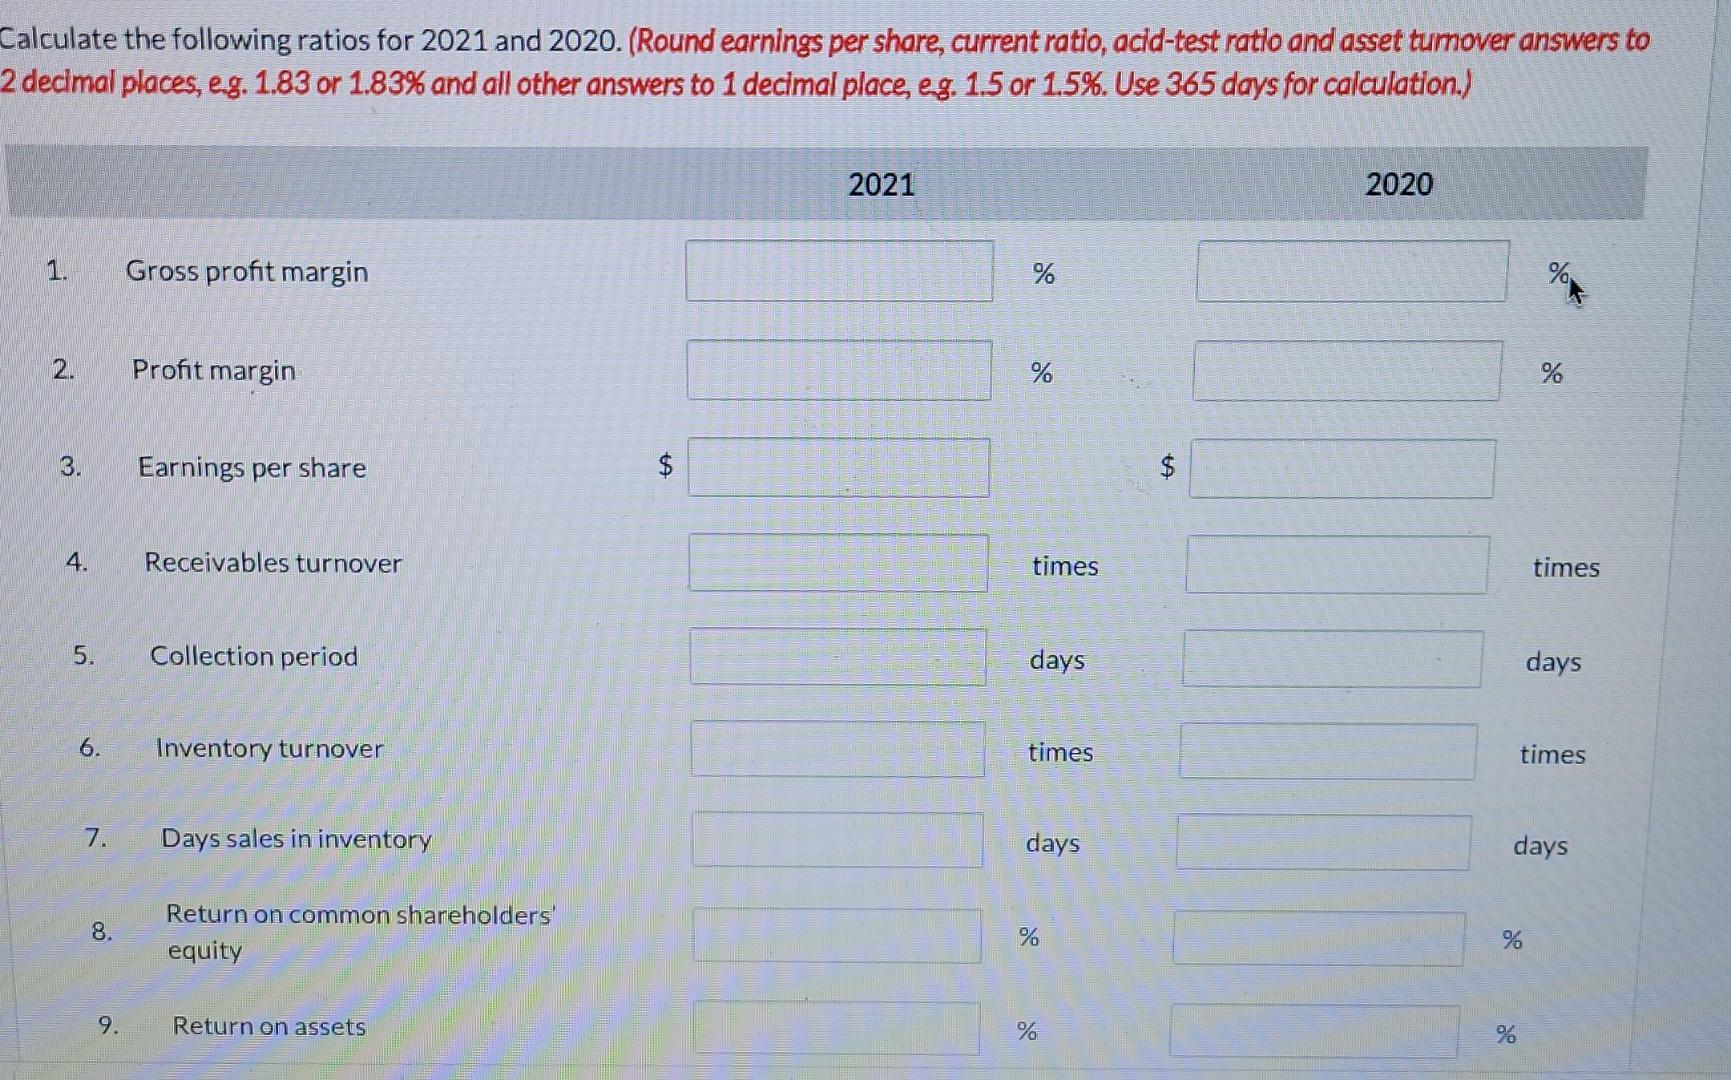
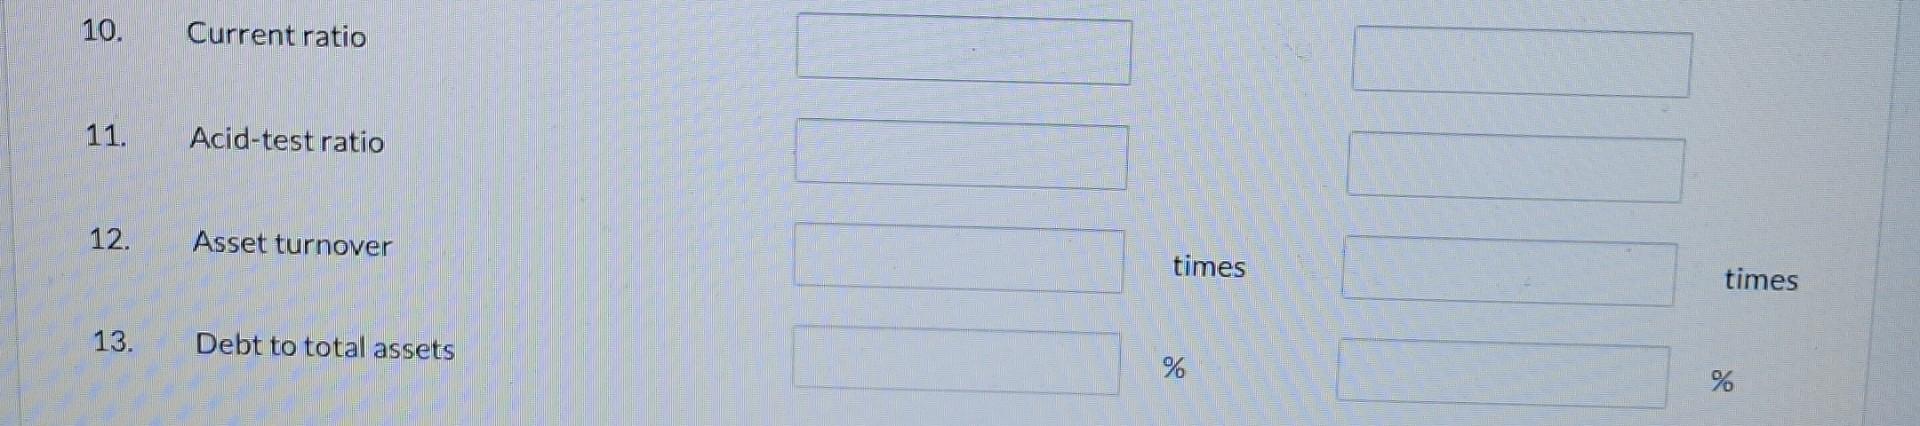
The comparative statements of Bridgeport Interiors Ltd. are presented as follows: BRIDGEPORT INTERIORS LTD. Income Statement For the Year Ended December 31 2021 2020 Net sales $2,098,750 $1,823,500 Cost of goods sold 1,171,000 1,003,500 Gross profit 927,750 820,000 Selling and administrative expenses 514,000 495,000 Income from operations 413.750 325,000 Other expenses and losses Interest expense 15.500 16,000 Income before income taxes 398,250 309.000 Income tax expense 106 775 65.000 Profit $291,475 $244.000 BRIDGEPORT INTERIORS LTD. Balance Sheet December 31 Assets 2021 2020 2019 Current assets Cash $80,000 $129.100 $115.000 Accounts receivable 187,200 108,600 103.000 Inventory 218,800 141,000 111,500 Total current assets 486.000 378,700 329.500 Property, plant, and equipment (net) 640.700 601,300 518,300 Total assets $1.126,700 $980,000 $847,800 Liabilities and Shareholders' Equity Current liabilities Accounts payable $286,175 $152,000 $141.400 Income taxes payable 49.000 45.000 43.500 Total current liabilities 335.175 197,000 184.900 Bonds payable 190.000 195.000 200.000 Bonds payable 190.000 195,000 200,000 Total liabilities 525,175 392,000 384,900 Shareholders' equity Common shares 280,000 280,000 300.000 Retained earnings 321,525 308,000 162.900 Total shareholders' equity 601,525 588,000 462.900 Total liabilities and shareholders' equity $1,126,700 $980,000 $847,800 Additional information: 1. All sales were on account. 2. Weighted-average common shares in 2021 were 52.000 and in 2020 were 54,000. Calculate the following ratios for 2021 and 2020. (Round earnings per share, current ratio, acld-test ratio and asset turnover answers to 2 decimal places, eg. 1.83 or 1.83% and all other answers to 1 decimal place, eg. 1.5 or 1.5%. Use 365 days for calculation.) 2021 2020 Gross profit margin % low 2. Profit margin % % 3. Earnings per share $ $ 4. Receivables turnover times times 5. Collection period days days 6. Inventory turnover times times 7. Days sales in inventory days days 8. Return on common shareholders equity % % 9. Return on assets % % 10. Current ratio 11. Acid-test ratio 12. Asset turnover times times 13. Debt to total assets % %
Step by Step Solution
There are 3 Steps involved in it
Step: 1

Get Instant Access to Expert-Tailored Solutions
See step-by-step solutions with expert insights and AI powered tools for academic success
Step: 2

Step: 3
Ace Your Homework with AI
Get the answers you need in no time with our AI-driven, step-by-step assistance
Get Started
HRD Score Card 2500 Based On HRD Audit
Authors: T V Rao
1st Edition
8178298368, 978-8178298368