Question
The computer-based oscilloscope called a Picoscope was used to make these measurements. Our Picoscopes have two input channels, labeled A and B. When the data
The computer-based oscilloscope called a Picoscope was used to make these measurements. Our Picoscopes have two input channels, labeled A and B. When the data was gathered, both input channels were used. The oscilloscope screen without any input looks like Figure 1:
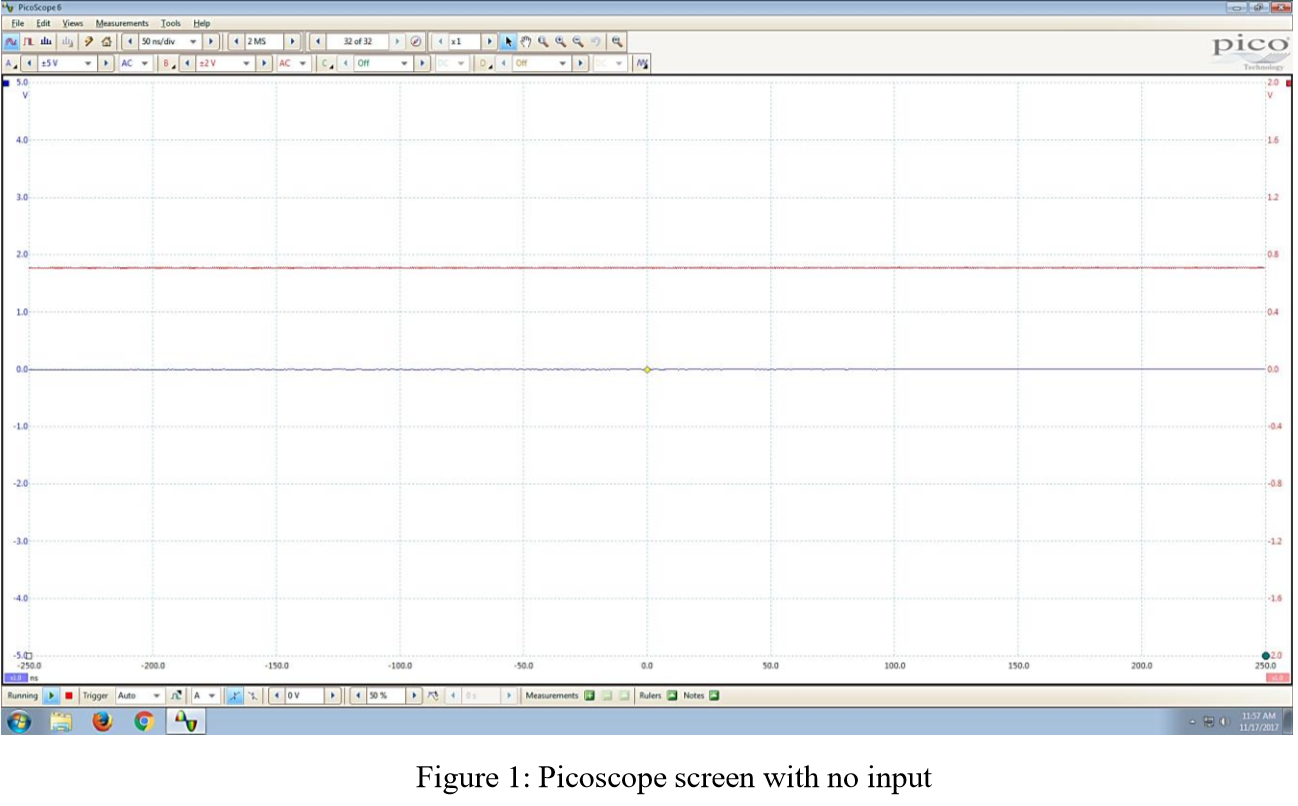
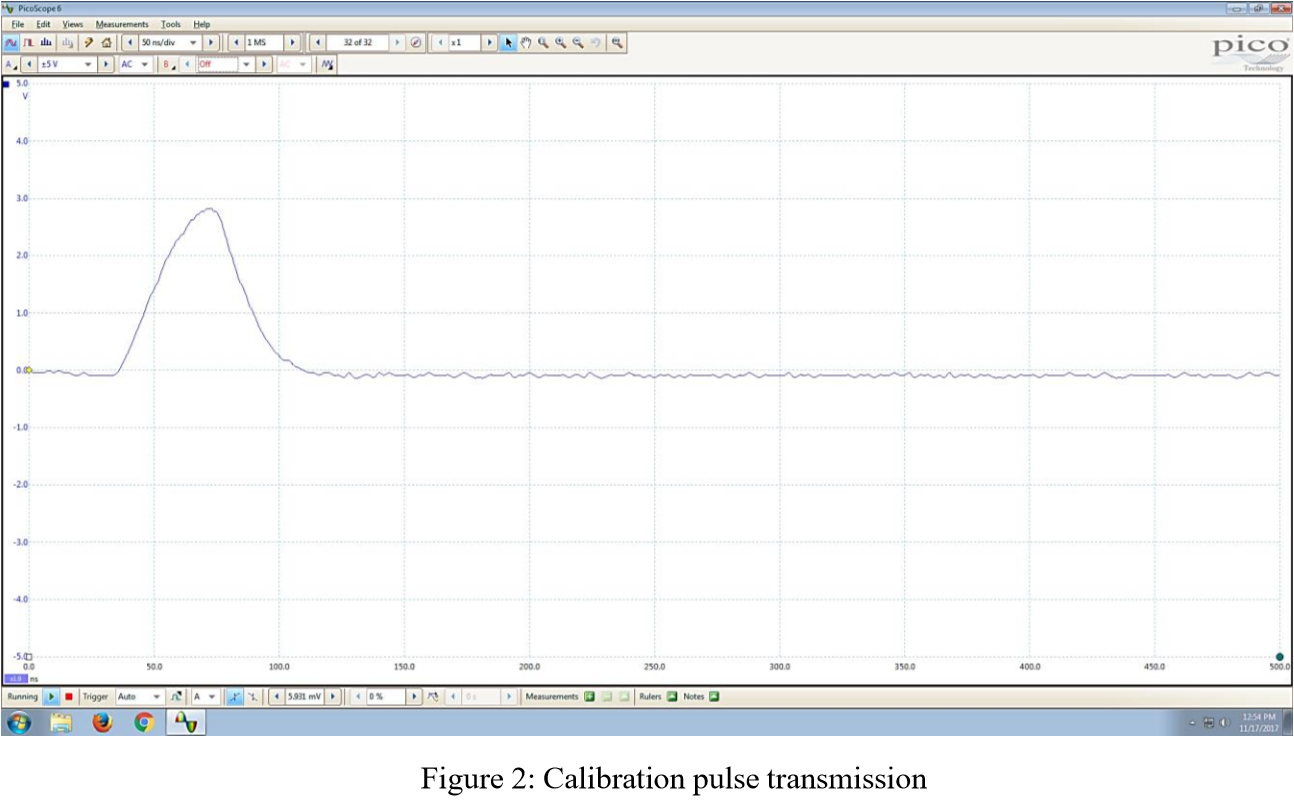
The voltage span for channels A and B were set to +/- 5V so that you have 1V per division. Both channels were set on AC. The time interval was set to .1 s per division. The speed of light apparatus was connected to the Picoscope, the channel A input of the Picoscope was connected to the blue test point marked "Reference" on the speed of light apparatus. The ground clip was connected to the ground test point just below the "Reference" test point to improve the trace quality. Channel B of the Picoscope was connected to the "Delay" test point and the ground clip was attached to the test point below the "Delay" test point. Before data was taken, the apparatus was calibrated. This was done by turning the "Calibration Delay" knob on the apparatus to the straight up position. With the 15-cm fiber optic cable attached to the AC adapter was plugged into the power receptacle on the left side of the board. The yellow lamp lit up at this point. A test pulse was observed on the oscilloscope as shown in Figure 2:
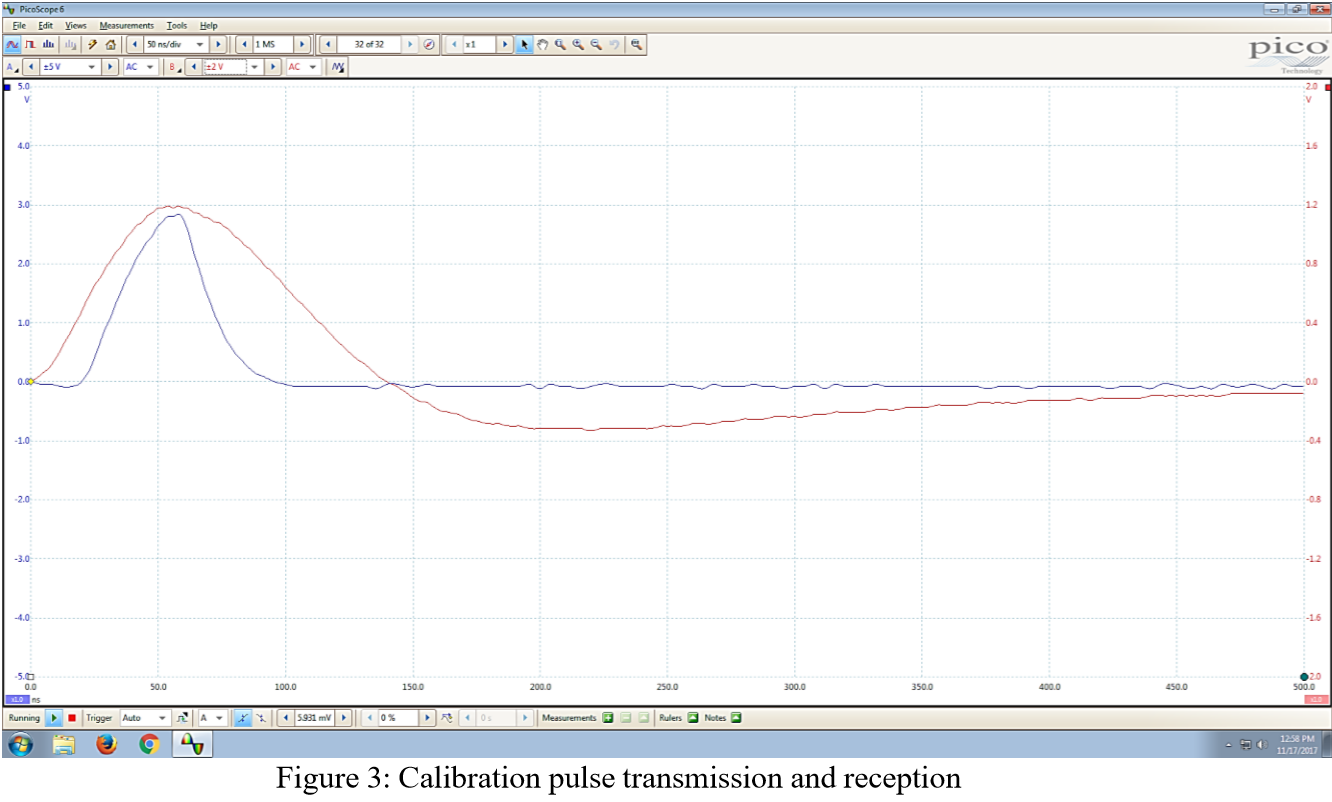
Channel B was turned back on a second pulse, was seen on the screen. The calibration knob was turned until the peaks of the two pulses were at the same time position on the Picoscope screen as shown in Figure 3:
For actual measurements of the speed of light, the 15-cm fiber optic was replaced with the longer 20-m fiber optic cable. Measure the time between the pulse transmission peak and the pulse reception peak. (For the fiber optical cable, the index of refraction is n = 1.60)
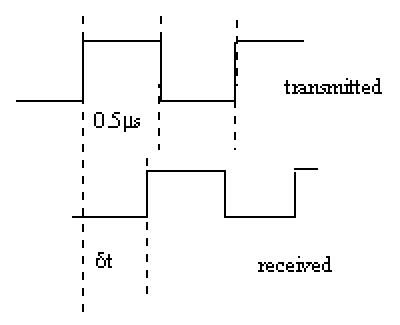
A solid state, square wave oscillator running at 1 MHz will produce a signal with a 1s period and a square pulse lasting 0.5 s. If this signal is used to modulate a light beam which passes along a fiber optic cable, we get a pulse of light lasting 0.5 s. A phototransistor can detect the pulse at the other end of the cable and convert it back into a pulse of electricity. The two electrical pulses (the original and the received one) can then be displayed on an oscilloscope screen. Since the light takes a finite amount of time to reach the receiver, the second signal will be delayed in time ( t) and the received pulse will be shifted along the time base axis. If we measure this shift it will tell us how long the light pulse took to travel the length of the fiber optic cable and hence the speed of the light can be calculated if the cable length is known.
Since light travels at about 300 million meters per second in air, if our fiber optic cable is 30-m long, we would be looking for a time delay of 0.1 s. When we monitor the electrical pulses, we are measuring the delay between transmitted and received electrical signals not the light pulses. If there is any time required for the conversion of light to electricity or vice versa, then this would introduce errors into the calculations. The fiber optic system was configured to transmit a high frequency modulated light beam along the cable which was 20-m in length. The transmitted pulse at Channel A and the received pulse at Channel B were recorded giving results shown in Figure 5:
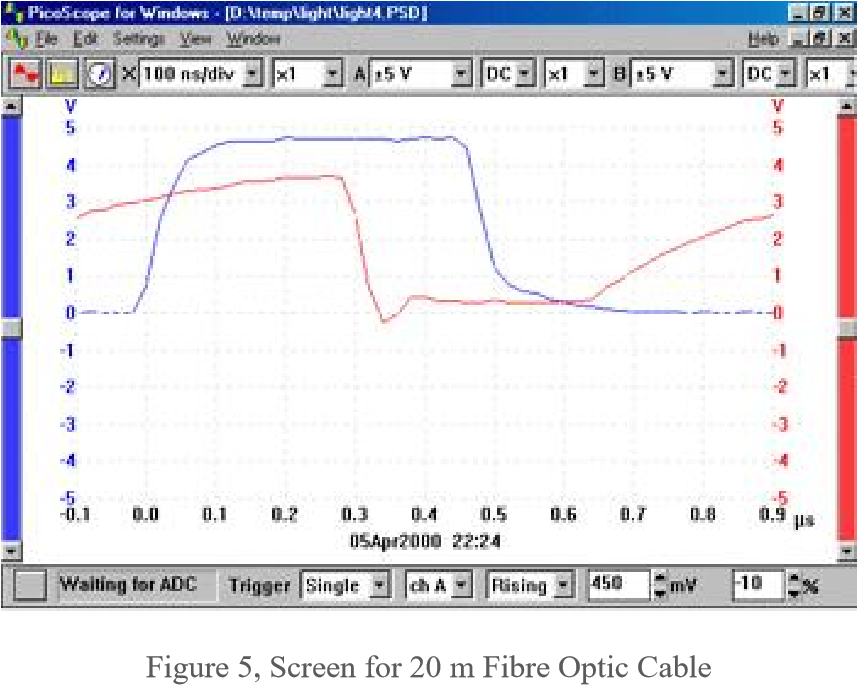
You can measure  t from Figure 5. This is the time it takes for the light to travel the 20-m length of the fiber optic cable. Refractive Index is defined as the ratio Speed of light in Air/Speed of light in the medium. Fiber optic cable is not a vacuum, hence you need to compensate the transmission speed for index of refraction. In this case we have:
1.6 = 3 x 10⁸/v where v is the speed in the fiber optic cable. Hence v = 3 x 10⁸/1.6 which gives 1.9 x 10⁸ ms-1
This should be comparted to the speed determined experimentally. The experimental speed is determined by dividing the distance by the time it takes the pulse to go through the 20-m fiber optic cable.
1. Measure the time between the pulse transmission peak and the pulse reception peak.
2. Why do you need to calibrate the speed of light apparatus? How often should you check this over the course of your experiment?
3. How sharp are the transmission and reception peaks? What are the uncertainties in the position of these peaks?
4. How stable are the transmission and reception peaks? What does this tell you about repeated measurements?
5. How could you improve the precision of your measurements? Which of these can be realistically accomplished in this experiment?
PLEASE HELP!! THE PROFESSOR DID NOT EXPLAIN ON HOW TO DO THIS. JUST GAVE ME THIS INFORMATION.
Picoscope Eile Edit Views I lay 5V Measurements Tools Help sonu/divD ACB -2 2 M 32 of 32 Off pico A AC Off | -2500 2900 -2000 -1000 50.0 100.0 100.0 150.0 90 250.0 Running Trigger Auto A O V .50% 0 Measurements Rulers Notes - 11/7/2017 Figure 1: Picoscope screen with no input " Picoscope 6 Eile Edit Views Measurements Tools Help y? Aso na/div D 1 MS 032 of 32 K D 4999 pico -5.0 500 100.0 200.0 250.0 4000 RID Running Trigger Auto A- 5931 mV 0 % 0 Measurements a Rulers Notes B O 11/07/2017 Figure 2: Calibration pulse transmission PicoScope 6 Eile Edit Views Measurements Tools Help 3 @sons/die D1 MS DO 320f321 SV ACB , 7:2V AC - My D24 pico A 50.0 100.0 150.0 200.0 250.0 300.0 350.0 4000 500.0 Ons Running Trigger Auto A X 5931 mv 0% 0 Measurements Rulers Notes 123 PM Figure 3: Calibration pulse transmission and reception - - - - - | - - - - - - = = received transmitted PiceScape lor windort Dompaghih PSDT El Edt Sang Ye Window LEX C00x100 ng/div.1 2415 Dcx 2015 EDC1 -5 0.7 0.8 0.91 -0.1 0.0 0.1 0.2 0.3 0.4 0.5 0.6 OSApr2000 22:24 Waiting for ADC Trigger Single A Rising 9 150 m 10 x Figure 5, Screen for 20 m Fibre Optic Cable Picoscope Eile Edit Views I lay 5V Measurements Tools Help sonu/divD ACB -2 2 M 32 of 32 Off pico A AC Off | -2500 2900 -2000 -1000 50.0 100.0 100.0 150.0 90 250.0 Running Trigger Auto A O V .50% 0 Measurements Rulers Notes - 11/7/2017 Figure 1: Picoscope screen with no input " Picoscope 6 Eile Edit Views Measurements Tools Help y? Aso na/div D 1 MS 032 of 32 K D 4999 pico -5.0 500 100.0 200.0 250.0 4000 RID Running Trigger Auto A- 5931 mV 0 % 0 Measurements a Rulers Notes B O 11/07/2017 Figure 2: Calibration pulse transmission PicoScope 6 Eile Edit Views Measurements Tools Help 3 @sons/die D1 MS DO 320f321 SV ACB , 7:2V AC - My D24 pico A 50.0 100.0 150.0 200.0 250.0 300.0 350.0 4000 500.0 Ons Running Trigger Auto A X 5931 mv 0% 0 Measurements Rulers Notes 123 PM Figure 3: Calibration pulse transmission and reception - - - - - | - - - - - - = = received transmitted PiceScape lor windort Dompaghih PSDT El Edt Sang Ye Window LEX C00x100 ng/div.1 2415 Dcx 2015 EDC1 -5 0.7 0.8 0.91 -0.1 0.0 0.1 0.2 0.3 0.4 0.5 0.6 OSApr2000 22:24 Waiting for ADC Trigger Single A Rising 9 150 m 10 x Figure 5, Screen for 20 m Fibre Optic CableStep by Step Solution
There are 3 Steps involved in it
Step: 1

Get Instant Access to Expert-Tailored Solutions
See step-by-step solutions with expert insights and AI powered tools for academic success
Step: 2

Step: 3

Ace Your Homework with AI
Get the answers you need in no time with our AI-driven, step-by-step assistance
Get Started


