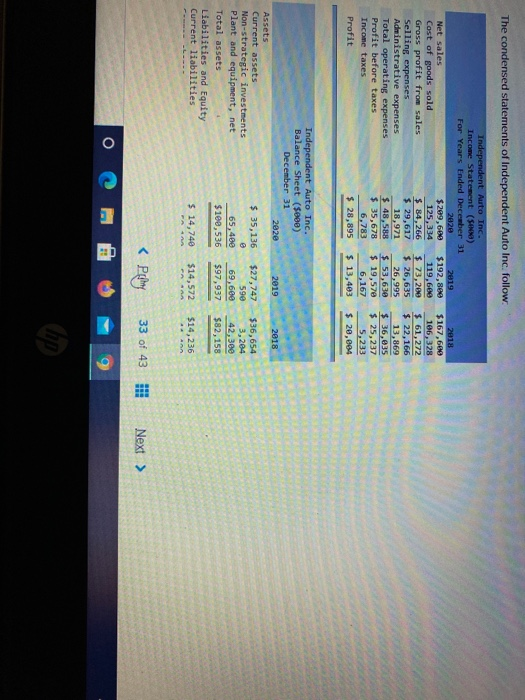
The condensed statements of Independent Auto Inc. follow Independent Auto Inc. Income Statement (569) For Years Ended December 31 2828 2819 Net sales $299,660 $192,889 Cost of goods sold 125,334 119,660 Gross profit from sales $ 84,266 $ 73,200 Selling expenses $ 29,617 $ 26,635 Administrative expenses 18,971 26,995 Total operating expenses $ 48,588 $ 53,630 Profit before taxes $ 35,678 $ 19,570 Income taxes 6,783 6,167 Profit $ 28,895 $ 13,403 2818 $167,660 106,328 $ 61,272 $ 22,166 13,869 $ 36,035 $ 25,237 5,233 $ 20,004 2019 2018 Independent Auto Inc. Balance Sheet (5000) December 31 282e Assets Current assets $ 35,136 Non-strategic investments Plant and equipment, net 65,400 Total assets $100,536 Liabilities and Equity Current liabilities $ 14,740 $27,747 590 69,600 $97,937 $36,654 3,284 42,300 $82,158 $14,572 $14,236 -- FA 33 of 43 Next > O Shares Retained earnings Total liabilities and equity 59,10 26,696 $100,536 24.205 $97,937 23,522 $82,153 Required: 1. Calculate each year's current ratio. (Round the final answers to 1 decimal place.) to 1 December 31, 2020 December 31, 2019 December 31, 2018 to 1 to 1 2. Express the income statement data in common-size percentages. (Round your final percentage answers to 2 decimal places.) INDEPENDENT AUTO INC. Common Size Comparative Income Statement (in %) For Years Ended December 31, 2020, 2019, and 2018 8 3. Express the balance sheet data in trend percentages with 2018 as the base year. (Round your final percentage answers to 2 decimal places.) INDEPENDENT AUTO INC. Balance Sheet Data in Trend Percentages (in %) December 31, 2020, 2019, and 2018 2020 2019 2018 Assets Current assets Non-strategic investments Plant and equipment, net Total assets Liabilities and Equity Current liabilities Common shares Retained earnings Total liabilities and equity 7 O