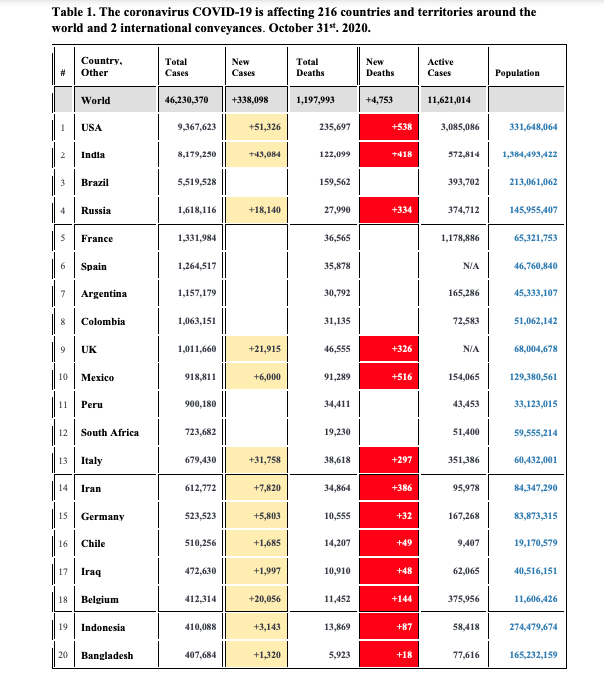
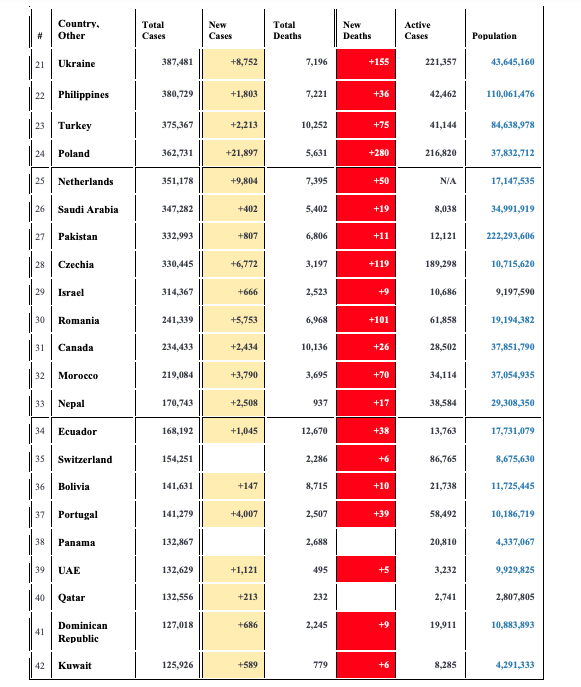
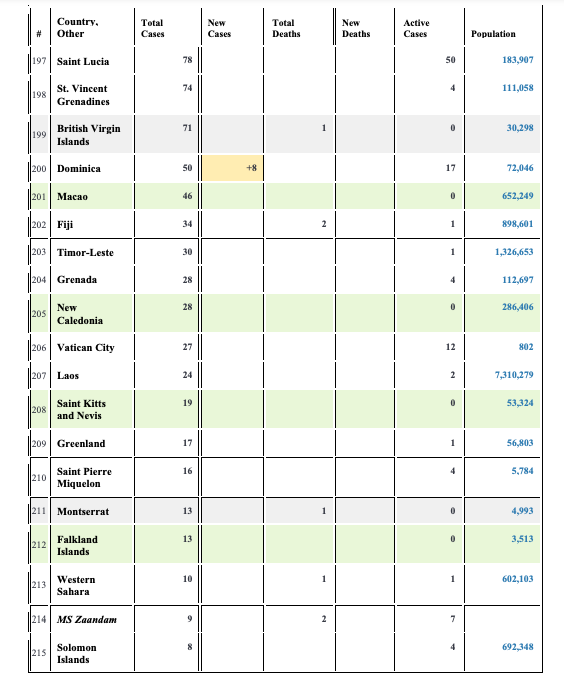
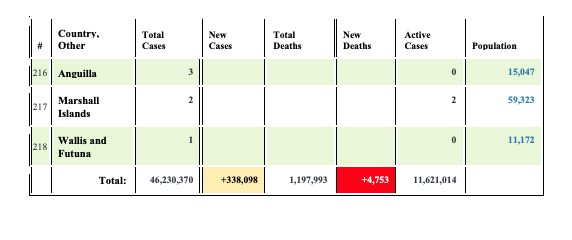
The confirmed Covid-19 caseload has risen rapidly day to day around the world. As of October 31st . Cause or case fatality rate for Covid-19 is approximately 2.6% worldwide (based on current statistical data available now). More than 46 million people are afflicted with Covid-19, and total number of deaths from Covid-19 is approximately 1.2 million people worldwide. Case fatality rate typically is used as a measure of disease severity and is often used for prognosis (predicting disease course or outcome), where comparatively high rates are indicative of relatively poor outcomes. It also can be used to evaluate the effect of new treatments (or health policy), with measures decreasing as treatments improve.
Countries across Europe are seeing a resurgence in COVID-19 cases after successfully slowing outbreaks early in the year. The vast majority of countries are declaring more cases each day now than they were during the first wave earlier this year. With cases of coronavirus surging around the world, regular people and policymakers alike want to know: Where are the new hotspots? And which countries are doing the best job in controlling outbreaks? You would think that developed countries would have a better policy response to the outbreak and thus, better outcome. However, data on coronavirus from World-meter indicate something different, confirmed Covid-19 caseload has risen rapidly in developed countries especially in Europe and north America with a higher case fatality rate Table 1. Looking at the surveillance data in the table, you will be surprised to find that China which has a population of more than 1.4 billion people has approximately 86,000 cases of COVID-19, South Korea which has a population of more than 51 million people has approximately 26,000 cases, Japan which has a population of more than 126 million people has approximately 100,400 cases. On the other hand if we take the top ten countries affected by the COVID-19 you will see that these countries accounts for more than two thirds of the cases in the world (Table 1). Speaking to a special session of the agency's Executive Board, WHO chief Tedros Adhanom Ghebreyesus said 10 countries account for 70 per cent of all reported cases and deaths, and just three countries account for half. Some nations took quick and decisive action against the pandemic, thus avoiding large outbreaks. And while some countries suffered large outbreaks, they were able to bring them under control and suppress the virus.
give examples, be sure to use citations and credible sources.
Questions
1. Why do you think there is a discrepancy between different countries in their response to the COVID-19?
2. What factors and/or characteristics might be responsible for this discrepancy?
3. The spread of many emerging infectious diseases has been reported to be influenced by socio-ecological factors, including socio-economic and climate factors do you think this discrepancy can be explained by the social ecological model? How explain?
4. Which country (or countries) do you think have a better policy response to the COVID19?
Why?
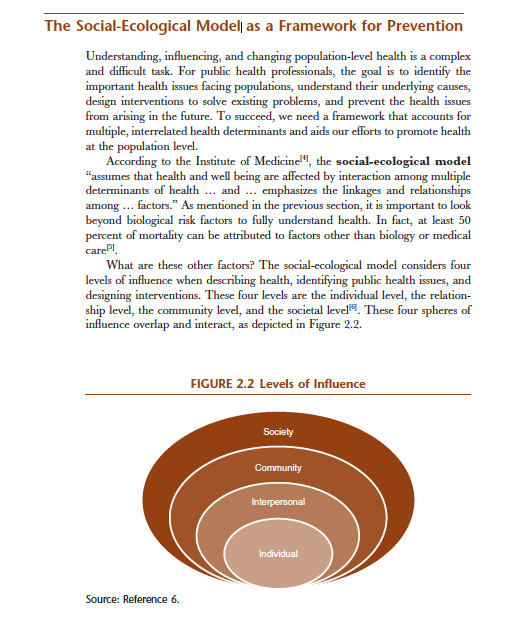
Table 1. The coronavirus COVID-19 is affecting 216 countries and territories around the world and 2 international conveyances. October 31". 2020. Country- Total New Total Other New Active Cases Cases Deaths Deaths Cases Population World 46,230.370 +338.098 1,197,993 +4,753 11,621,014 USA 9,367.623 +51,326 235,697 +538 3,085,086 331,648,064 India 8,179.250 +:13,084 122,099 +418 372,614 1,384,493,422 Brazil 5,519.528 159,562 393,702 213,061,062 Russia 1,618,116 +18,140 27,990 +33 374,712 145,955,407 France 1,331,984 36.565 1,178,886 65,321,753 Spain 1,264,517 35,878 NIA 46,760,8-40 Argentina 1,157,179 30,792 165,286 45,333,107 Colombia 1,063,151 31,135 72,583 51,062,142 UK 1,011,660 +21,915 46.555 -326 NIA 68,004,678 Mexico 918,811 +6,000 91,289 +516 154,065 129,380,561 11 Peru 900,180 34,411 43,453 33,123,015 12 South Africa 723,682 19,230 51,400 59,555,214 Italy 679.430 +31,758 38,618 +297 351,386 60,432,001 Iran 612,772 +7,820 34,864 +386 95.978 84,347,290 Germany 523.523 +5,803 10,555 +31 167,268 83,873,315 16 Chile 510.256 +1,685 14,207 9.407 19,170,579 17 Iraq 472,630 +1,997 10,910 +48 62,065 10,516,151 Belgium 412,314 +20,056 11,452 +144 375,956 11,606,426 19 Indonesia 410,088 +3,143 13,869 +87 58,418 274,479,674 Bangladesh 407.684 +1,320 5,923 +18 77,616 165,232,159Country. Total New Total Other New Active Cases Cases Deaths Deaths Cases Population 21 Ukraine 387,481 +8,752 7,196 +155 221,357 43,645,160 22 Philippines 380,729 +1,803 7,221 +36 42,462 110,061,476 Turkey 375,367 +2,213 10,252 +75 41,144 84,638,978 Poland 362,731 +21,897 5,631 +280 216,820 37,832,712 Netherlands 351,178 +9.804 7,395 +50 NIA 17,147,535 26 Saudi Arabia 347,282 +402 5,402 +19 8,038 34,991,919 27 Pakistan 332.993 +807 6.806 +11 12,121 212,293,606 28 Czechia 330.445 +6,772 3,197 +119 189.298 10,715,620 19 Israel 314,367 +666 2,523 +-9 10,686 9,197,590 Romania 241.339 +5,753 6.968 +101 61,858 19,194,382 31 Canada 234,433 +2,434 10,136 +20 28.502 37,851,790 Morocco 219,084 +3,790 3,695 +70 34,114 37,054,935 35 Nepal 170,743 +2,508 937 +17 38,584 29,308,350 34 Ecuador 168,192 +1,045 12,670 +38 13,763 17,731,079 35 Switzerland 154,251 2,286 86,765 8,675,630 36 Bolivia 141,631 +147 8,715 +10 21,738 11,725,445 Portugal 141,279 +4,007 2,507 +39 58,492 10,186,719 Panama 132,867 2,688 20,810 4,337,067 UAE 132.629 +1,121 495 +5 3,232 9,929,825 Qatar 132,556 +213 232 2,741 2,807,805 41 Dominican 127,018 +686 2,245 19,911 10,883,893 Republic Kuwait 125,926 +580 779 +6 8,285 4,191,333Country. Total New Total New Active Other Cases Cases Deaths Deaths Cases Population 197 Saint Lucia 183,907 St. Vincent 74 111,058 198 Grenadines 71 30,298 190 British Virgin Islands 200 Dominica 17 72,046 201 Macao 16 652,249 202 Fiji 34 2 898,601 Timor-Leste 1,326,653 204 Grenada 112,697 28 205 New 286,406 Caledonia 206 Vatican City 27 12 810 2 207 Laos 24 2 7,310,279 19 53,324 208 Saint Kitts and Nevis 209 Greenland 17 56,803 210 Saint Pierre 16 5,784 Miquelon 211 Montserrat 13 4.993 212 Falkland 13 3,513 Islands 1 602,103 213 Western Sahara 214 MS Zaandam 2 T Solomon 692.348 215 IslandsCountry. Total New Total New Active # Other Cases Cases Deaths Deaths Cases Population 216 Anguilla 15,047 217 Marshall 2 59323 Islands 1218 Wallis and 11,172 Futuna Total: 46.230.370 +338,098 1,197,993 +4,753 11,621.014The Social-Ecological Modell as a Framework for Prevention Understanding, influencing, and changing population-level health is a complex and difficult task. For public health professionals, the goal is to identify the important health issues facing populations, understand their underlying causes, design interventions to solve existing problems, and prevent the health issues from arising in the future. To succeed, we need a framework that accounts for multiple, interrelated health determinants and aids our efforts to promote health at the population level. According to the Institute of Medicine ", the social-ecological model "assumes that health and well being are affected by interaction among multiple determinants of health ... and ... emphasizes the linkages and relationships among ... factors." As mentioned in the previous section, it is important to look beyond biological risk factors to fully understand health. In fact, at least 50 percent of mortality can be attributed to factors other than biology or medical care 3. What are these other factors? The social-ecological model considers four levels of influence when describing health, identifying public health issues, and designing interventions. These four levels are the individual level, the relation- ship level, the community level, and the societal level. These four spheres of influence overlap and interact, as depicted in Figure 2.2. FIGURE 2.2 Levels of Influence Society Community Interpersonal Individual Source: Reference 6