Answered step by step
Verified Expert Solution
Link Copied!

Question

1 Approved Answer

The contingency table below shows the results of a random sample of 200 state representatives that was conducted to see whether their opinions on a

The contingency table below shows the results of a random sample of 200 state representatives that was conducted to see whether their opinions on a bill are related to their party affiliations. Use?= 0.05.
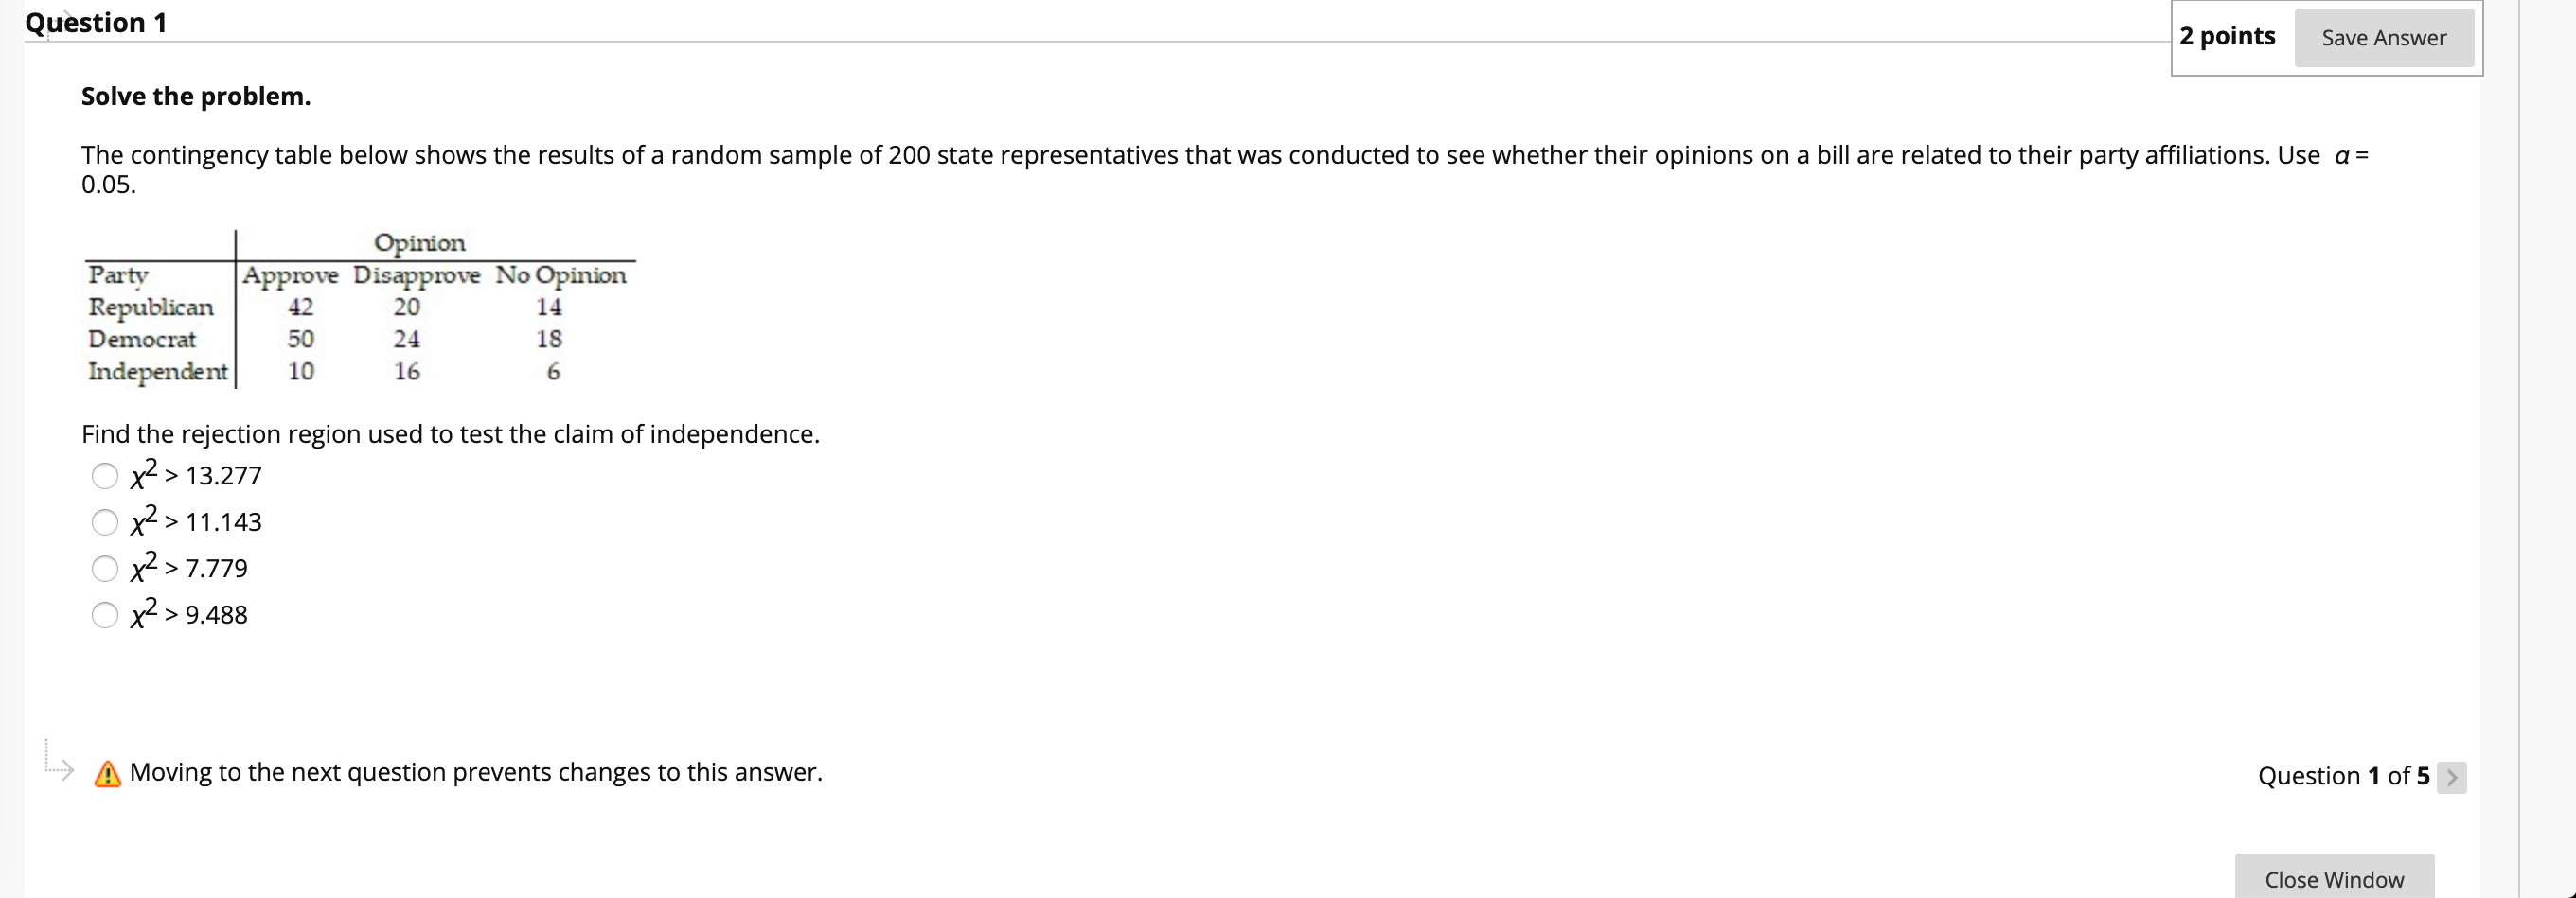
image text in transcribed
Question 1 2 points Save Answer Solve the problem. The contingency table below shows the results of a random sample of 200 state representatives that was conducted to see whether their opinions on a bill are related to their party affiliations. Use a = 0.05. Opinion Party Approve Disapprove No Opinion Republican 42 20 14 Democrat 50 24 18 Independent 10 16 6 Find the rejection region used to test the claim of independence. O x2 > 13.277 O x2 > 11.143 O x2 > 7.779 O x2> 9.488 > A Moving to the next question prevents changes to this answer. Question 1 of 5 > Close Window

Step by Step Solution

There are 3 Steps involved in it

Step: 1

blur-text-image

Get Instant Access to Expert-Tailored Solutions

See step-by-step solutions with expert insights and AI powered tools for academic success

Step: 2

blur-text-image

Step: 3

blur-text-image

Ace Your Homework with AI

Get the answers you need in no time with our AI-driven, step-by-step assistance

Get Started

Recommended Textbook for

Elementary Statisitcs

Authors: Barry Monk

2nd edition

1259345297, 978-0077836351, 77836359, 978-1259295911, 1259295915, 978-1259292484, 1259292487, 978-1259345296

More Books

Students also viewed these Mathematics questions