

Question: The correct graph is b. Should the project be accepted if r=7% ? Should the project be accepted if r=15% ? c. What is the
The correct graph is\ b. Should the project be accepted if
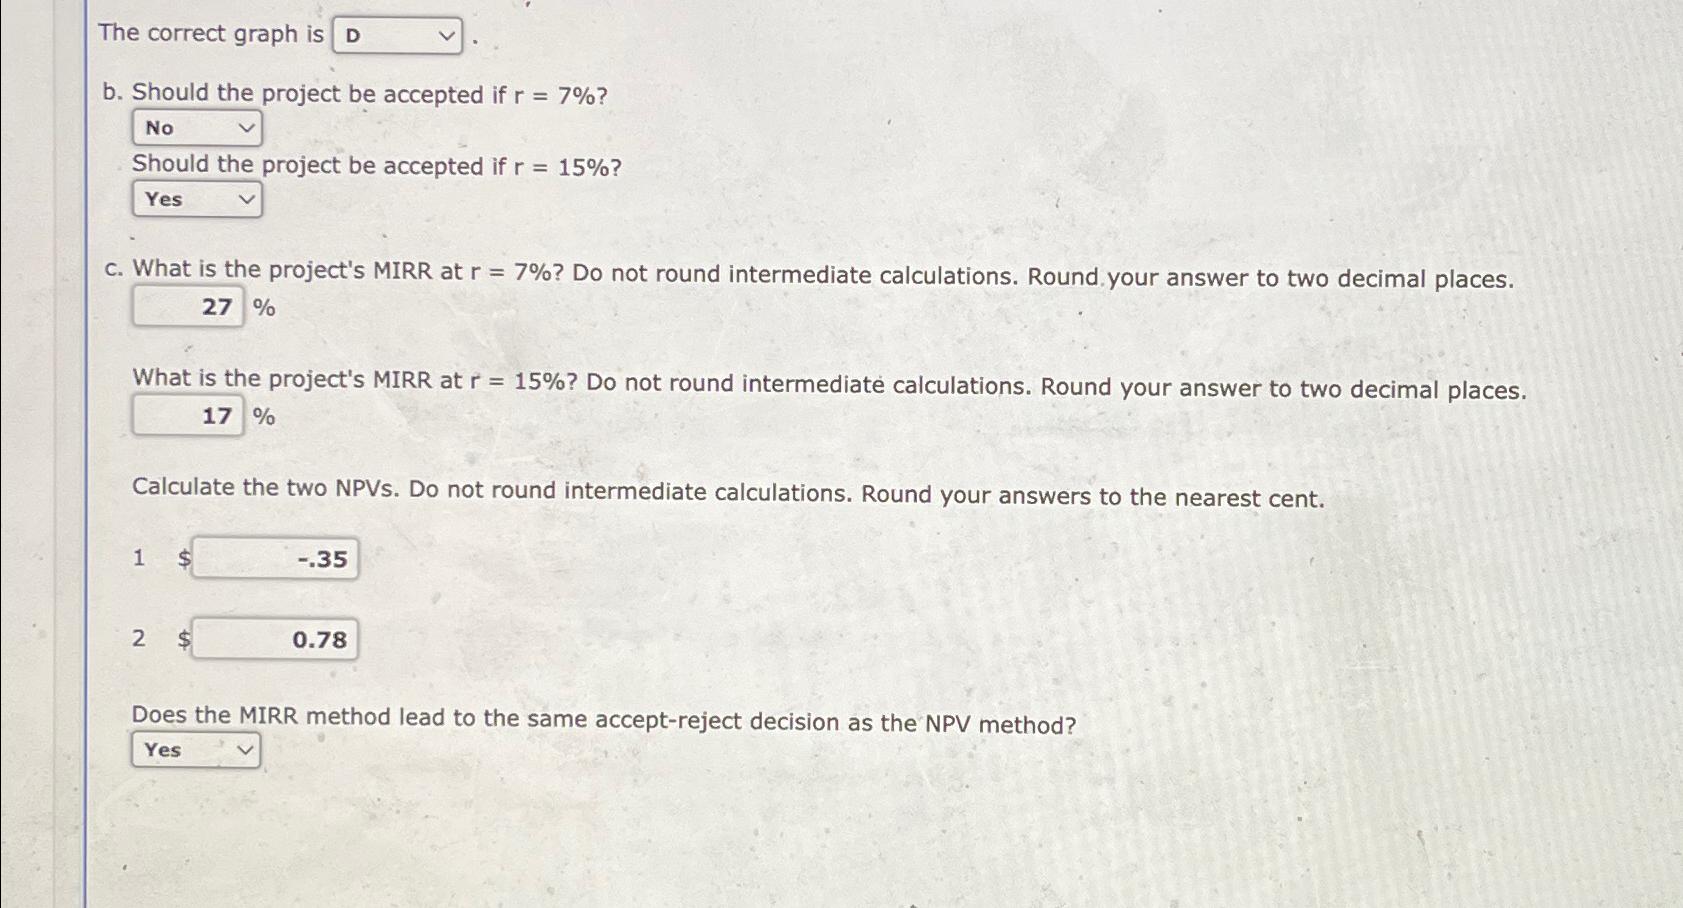
r=7%?\ Should the project be accepted if
r=15%?\ c. What is the project's MIRR at
r=7%? Do not round intermediate calculations. Round your answer to two decimal places.
%\ What is the project's MIRR at
r=15%? Do not round intermediate calculations. Round your answer to two decimal places.
%\ Calculate the two NPVs. Do not round intermediate calculations. Round your answers to the nearest cent.\
1$\
2$\ Does the MIRR method lead to the same accept-reject decision as the NPV method?
The correct graph is b. Should the project be accepted if r=7% ? Should the project be accepted if r=15% ? c. What is the project's MIRR at r=7% ? Do not round intermediate calculations. Round your answer to two decimal places. % What is the project's MIRR at r=15% ? Do not round intermediate calculations. Round your answer to two decimal places. % Calculate the two NPVs. Do not round intermediate calculations. Round your answers to the nearest cent. 1 2$ Does the MIRR method lead to the same accept-reject decision as the NPV method? The correct graph is b. Should the project be accepted if r=7% ? Should the project be accepted if r=15% ? c. What is the project's MIRR at r=7% ? Do not round intermediate calculations. Round your answer to two decimal places. % What is the project's MIRR at r=15% ? Do not round intermediate calculations. Round your answer to two decimal places. % Calculate the two NPVs. Do not round intermediate calculations. Round your answers to the nearest cent. 1 2$ Does the MIRR method lead to the same accept-reject decision as the NPV method
Step by Step Solution
There are 3 Steps involved in it

Get step-by-step solutions from verified subject matter experts