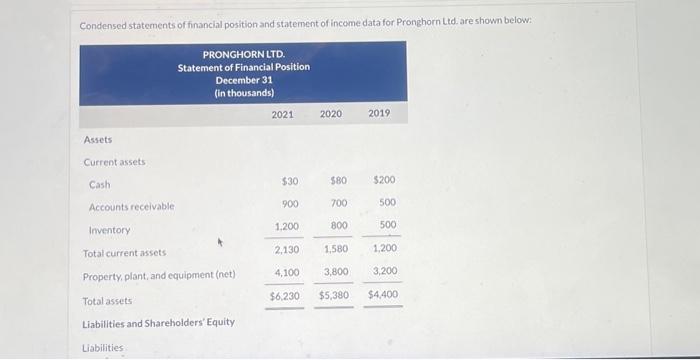
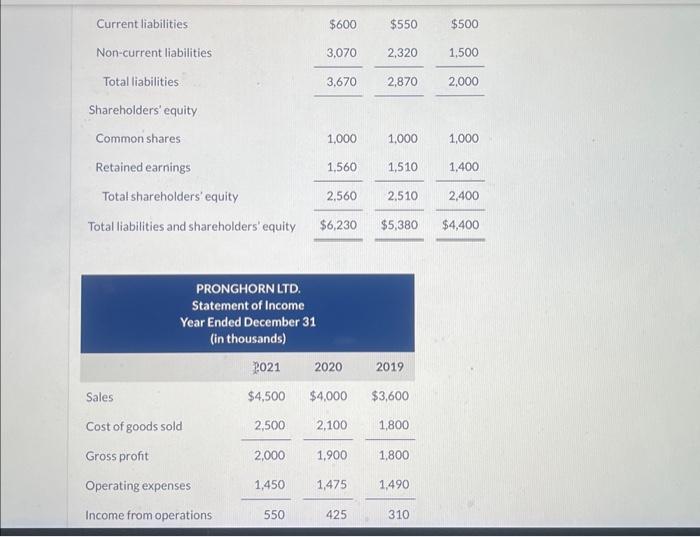
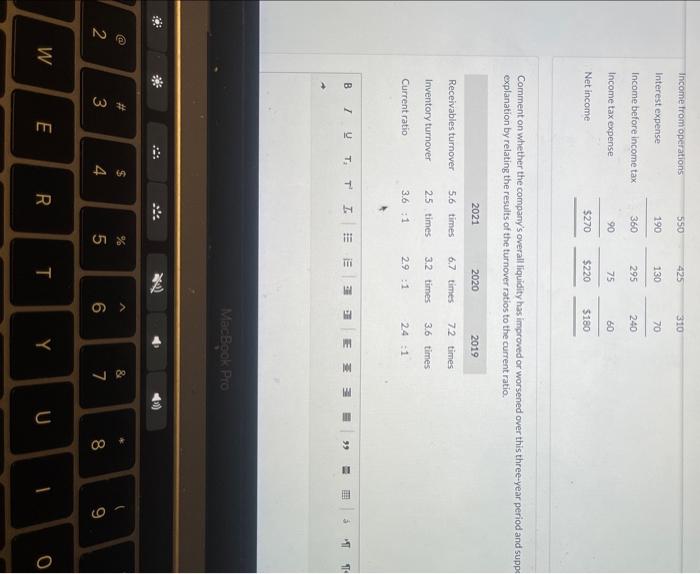
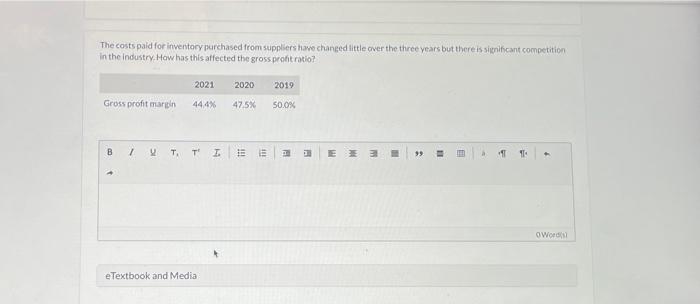
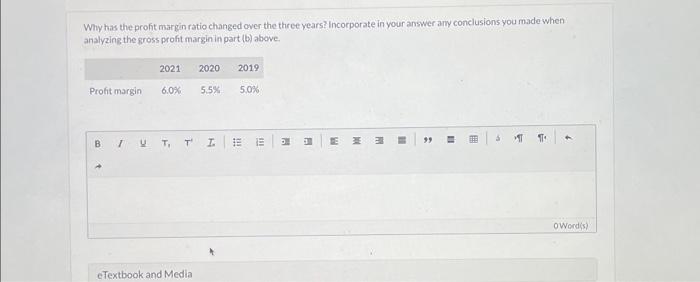
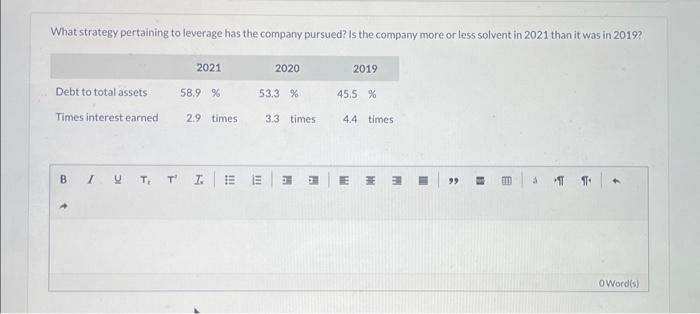
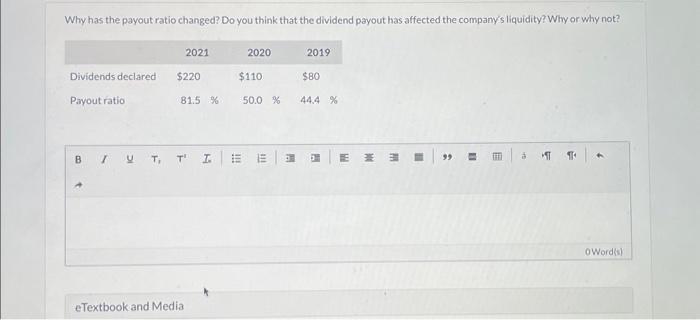
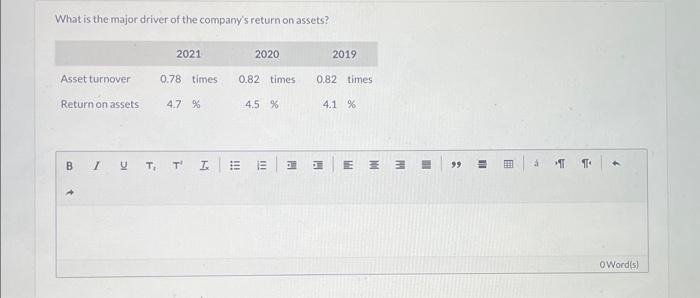
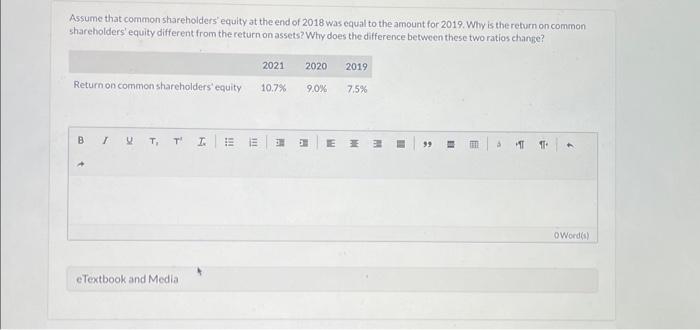
The costs paid for inventory purchased from suppliers hawe changed little over the three years but there is significant competition in the industry. How has this affected the gross profit ratio? Why has the profit margin ratio changed over the three vears? Incorporate in your answer any conclusions you made when ahatyzing the sross profit margin in port tb) above. Why has the payout ratio changed? Do you think that the dividend payout has affected the company's liquidity? Winy or why not? Comment on whether the company's overall liquidity has improved or worsened over this three-year period and supp explanation by relating the results of the turnover ratios to the current ratio. What is the major driver of the company's return on assets? Assume that common shareholders equity at the end of 2018 was equal to the amount for 2019 . Why is the return on common shareholders' equity different from the return on assets? Why does the difference between these two ratios ehante? What strategy pertaining to leverage has the company pursued? Is the company more or less solvent in 2021 than it was in 2019 ? Condensed statements of financial position and statement of income data for Pronghorn L td. are shown below: \begin{tabular}{|c|c|c|c|} \hline Current liabilities & $600 & $550 & $500 \\ \hline Non-current liabilities & 3,070 & 2,320 & 1,500 \\ \hline Total liabilities & 3,670 & 2,870 & 2,000 \\ \hline \multicolumn{4}{|l|}{ Shareholders' equity } \\ \hline Commonshares & 1,000 & 1,000 & 1,000 \\ \hline Retained earnings & 1,560 & 1,510 & 1,400 \\ \hline Total shareholders' equity & 2,560 & 2,510 & 2,400 \\ \hline Total liabilities and shareholders' equity & $6,230 & $5,380 & $4,400 \\ \hline \end{tabular} \begin{tabular}{|c|c|c|c|} \hline \multicolumn{4}{|c|}{PRONGHORNLTD.StatementofIncomeYearEndedDecember31(inthousands)} \\ \hline * & 2021 & 2020 & 2019 \\ \hline Sales & $4,500 & $4,000 & $3,600 \\ \hline Cost of goods sold & 2,500 & 2,100 & 1,800 \\ \hline Gross profit & 2,000 & 1,900 & 1,800 \\ \hline Operating expenses & 1,450 & 1,475 & 1,490 \\ \hline Income from operations & 550 & 425 & 310 \\ \hline \end{tabular}
