

Answered step by step
Verified Expert Solution
Question
1 Approved Answer
The county assessor is studying housing demand and is interested in developing a regression model to estimate the market value (i.e., selling price) of residential
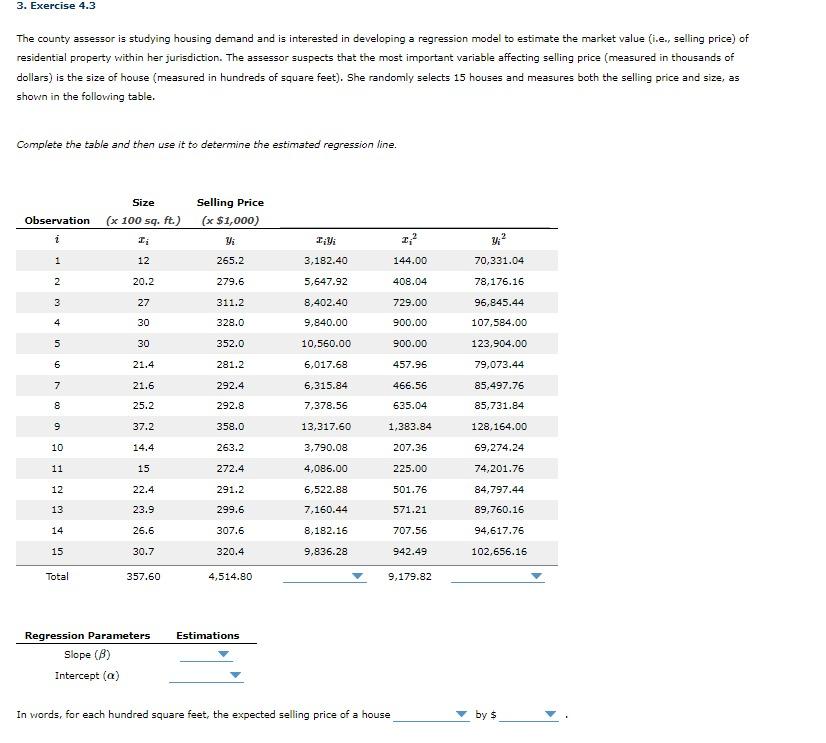
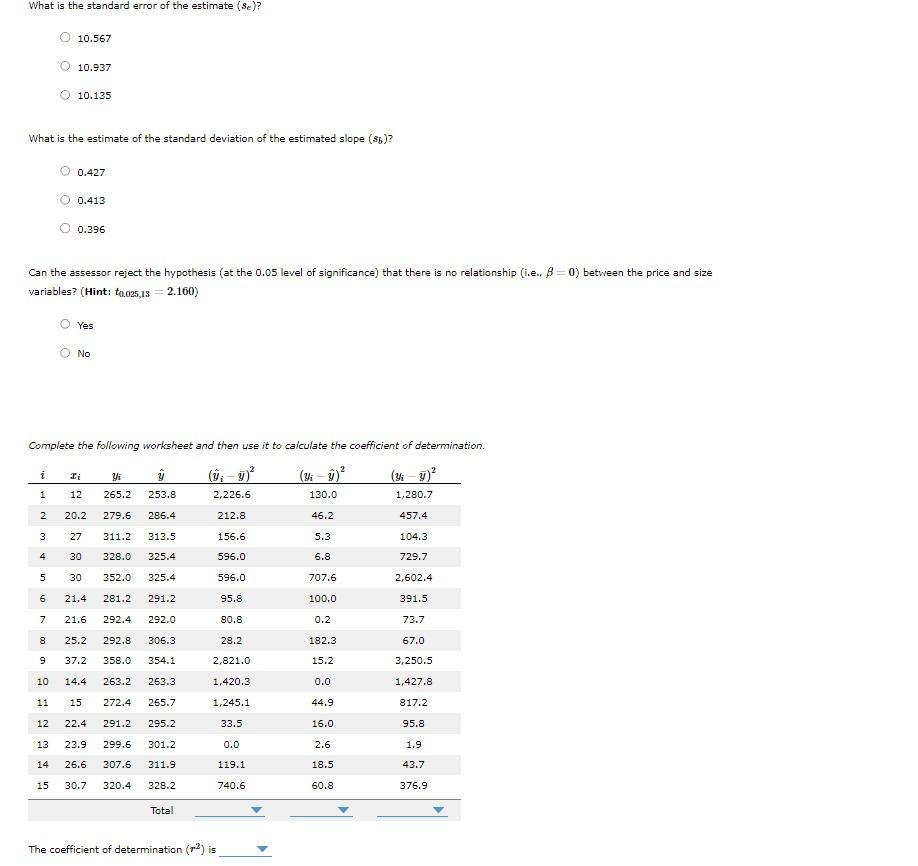
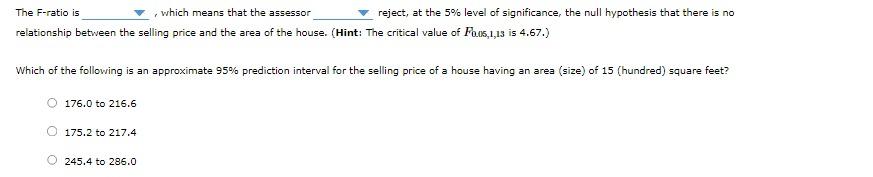
The county assessor is studying housing demand and is interested in developing a regression model to estimate the market value (i.e., selling price) of residential property within her jurisdiction. The assessor suspects that the most important variable affecting selling price (measured in thousands of dollars) is the size of house (measured in hundreds of square feet). She randomly selects 15 houses and measures both the selling price and size, as shown in the following table. Complete the table and then use it to determine the estimated regression line. In words, for each hundred square feet, the expected selling price of a house by 5 10.567 10.937 10.135 What is the estimate of the standard deviation of the estimated slope (sb) ? 0.427 0.413 0.396 Can the assessor reject the hypothesis (at the 0.05 level of significance) that there is no relationship (i.e., =0 ) between the price and size variables? (Hint: t0.025,13=2.160) Yes No Complete the following worksheet and then use it to calculate the coefficient of determination. The coefficient of determination (r2) is The F-ratio is , which means that the assessor reject, at the 5% level of significance, the null hypothesis that there is no relationship between the selling price and the area of the house. (Hint: The critical value of F0.05,1,13 is 4.67. ) Which of the following is an approximate 95% prediction interval for the selling price of a house having an area (size) of 15 (hundred) square feet? 176.0 to 216.6 175.2 to 217.4 245.4 to 286.0 The county assessor is studying housing demand and is interested in developing a regression model to estimate the market value (i.e., selling price) of residential property within her jurisdiction. The assessor suspects that the most important variable affecting selling price (measured in thousands of dollars) is the size of house (measured in hundreds of square feet). She randomly selects 15 houses and measures both the selling price and size, as shown in the following table. Complete the table and then use it to determine the estimated regression line. In words, for each hundred square feet, the expected selling price of a house by 5 10.567 10.937 10.135 What is the estimate of the standard deviation of the estimated slope (sb) ? 0.427 0.413 0.396 Can the assessor reject the hypothesis (at the 0.05 level of significance) that there is no relationship (i.e., =0 ) between the price and size variables? (Hint: t0.025,13=2.160) Yes No Complete the following worksheet and then use it to calculate the coefficient of determination. The coefficient of determination (r2) is The F-ratio is , which means that the assessor reject, at the 5% level of significance, the null hypothesis that there is no relationship between the selling price and the area of the house. (Hint: The critical value of F0.05,1,13 is 4.67. ) Which of the following is an approximate 95% prediction interval for the selling price of a house having an area (size) of 15 (hundred) square feet? 176.0 to 216.6 175.2 to 217.4 245.4 to 286.0
Step by Step Solution
There are 3 Steps involved in it
Step: 1

Get Instant Access to Expert-Tailored Solutions
See step-by-step solutions with expert insights and AI powered tools for academic success
Step: 2

Step: 3
Ace Your Homework with AI
Get the answers you need in no time with our AI-driven, step-by-step assistance
Get Started
Financial Accounting Objective Questions And Explanations
Authors: Irvin N. Gleim
6th Edition
0917537718, 978-0917537714