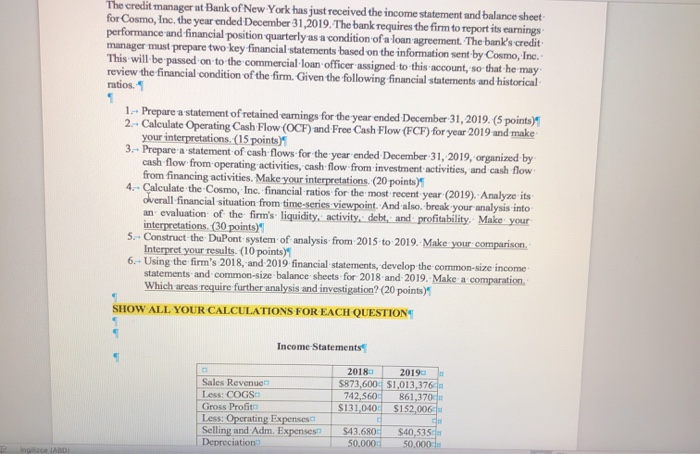
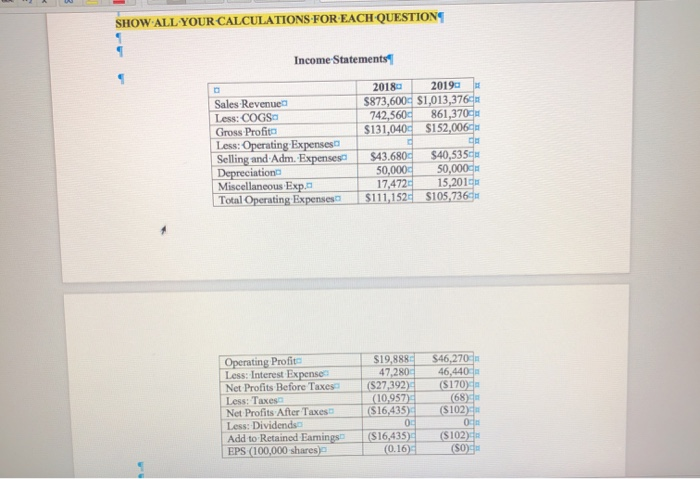
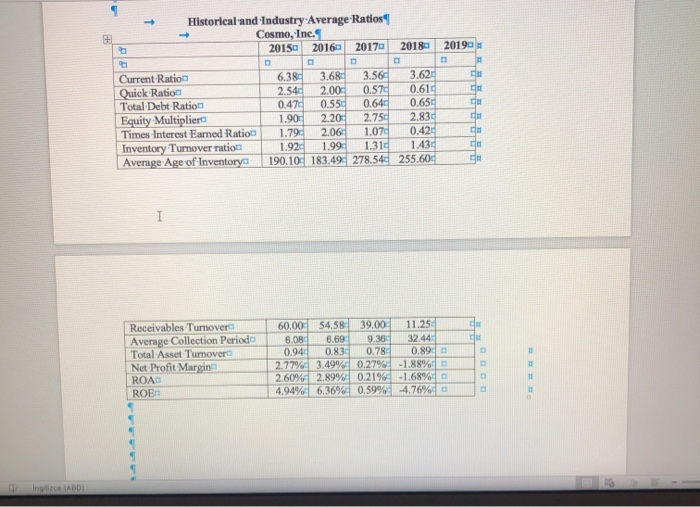
The credit manager at Bank of New York has just received the income statement and balance sheet for Cosmo, Inc. the year ended December 31, 2019. The bank requires the firm to report its earnings performance and financial position quarterly as a condition of a loan agreement. The bank's credit manager must prepare two key financial statements based on the information sent by Cosmo, Inc. This will be passed on to the commercial loan officer assigned to this account, so that he may review the financial condition of the firm. Given the following financial statements and historical ratios. 1 1.- Prepare a statement of retained earnings for the year ended December 31, 2019. (5 points) 2.- Calculate Operating Cash Flow (OCF) and Free Cash Flow (FCF) for year 2019 and make your interpretations. (15 points) 3.- Prepare a statement of cash flows for the year ended December 31, 2019, organized by cash flow from operating activities, cash flow from investment activities, and cash flow from financing activities. Make your interpretations. (20 points) 4. Calculate the Cosmo, Inc. Financial ratios for the most recent year (2019). Analyze its overall financial situation from time-series viewpoint. And also break your analysis into an evaluation of the firm's liquidity, activity, debt, and profitability. Make your interpretations. (30 points)! 5.- Construct the DuPont system of analysis from 2015 to 2019. Make your comparison Interpret your results. (10 points) 6. Using the firm's 2018, and 2019 financial statements, develop the common-size income statements and common-size balance sheets for 2018 and 2019. Make a comparation Which areas require further analysis and investigation? (20 points) SHOW ALL YOUR CALCULATIONS FOR EACH QUESTIONS 5 Income Statements Sales Revenue Less: COGS Gross Profit Less: Operating Expenses Selling and Adm. Expenses Depreciation 2018 2019 $873,600 $1,013,376 742,560 861,370d $131,040 $152,006 de $43.6800 $40,5350 50.000 50.000 Inge ABDI SHOW ALL YOUR CALCULATIONS FOR EACH QUESTIONS Income Statements Sales Revenue Less: COGS Gross Profit Less: Operating Expenses Selling and Adm. Expenses Depreciation Miscellaneous Exp. Total Operating Expenses 2018 2019 $873,6004 $1,013,376 742,5600 861,3700 $131,0404 $152,006 de $43.6800 $40,535 50,000 50,000 17,472 15,2010 $111,152 S105,736 Operating Profite Less: Interest Expenses Net Profits Before Taxes Less: Taxes Net Profits After Taxes Less: Dividends Add to Retained Eamings EPS (100,000 shares) $19,888 47,280 (S27,392) (10,957) ($16,435) 0 (S16,435) (0.16 $46,270 46,440 ($170 (68) ($102) 0 (S102) (50 Historical and Industry Average Ratios Cosmo, Inc. 2015 20160 20170 2018 2019 CH de dh Current Ratio Quick Ration Total Debt Ratio Equity Multipliers Times Interest Earned Ration Inventory Turnover ratio Average Age of Inventory 6.384 3.68 3.560 3.624 2.540 2.00 0.570 0.610 0.470 0.550 0.640 0.650 1.900 2.20 2.750 2.836 1.794 2.06. 1.070 0.42 1.92 1.99 1.310 1.43 190.100 183.49 278.54 255.600 de CH I Receivables Turnover Average Collection Periode Total Asset Turnovera Net Profit Margine ROAD ROE 60.00 54.58 39,00 11.25 6.08 6.69 9.38 32.44 0.94 0.83 0.78 0.89 2.77% 3.49% 0.27% -1.88% 2.60% 2.89% 0.21% -1.68% 4.94% 6,36% 0.59% -4.76% ing (ABD)