Answered step by step
Verified Expert Solution
Question
1 Approved Answer
the .csv file: School Year Won Loss Tie Alabama 1995 3 0 0 Alabama 1996 10 3 0 Alabama 1997 7 4 0 Alabama 1998

the .csv file:
| School | Year | Won | Loss | Tie |
| Alabama | 1995 | 3 | 0 | 0 |
| Alabama | 1996 | 10 | 3 | 0 |
| Alabama | 1997 | 7 | 4 | 0 |
| Alabama | 1998 | 4 | 7 | 0 |
| Alabama | 1999 | 7 | 5 | 0 |
| Alabama | 2000 | 10 | 3 | 0 |
| Alabama | 2001 | 3 | 8 | 0 |
| Alabama | 2002 | 7 | 5 | 0 |
| Alabama | 2003 | 10 | 3 | 0 |
| Alabama | 2004 | 6 | 6 | 0 |
| Alabama | 2005 | 10 | 1 | 0 |
| Alabama | 2006 | 6 | 7 | 0 |
| Alabama | 2007 | 2 | 6 | 0 |
| Alabama | 2008 | 12 | 2 | 0 |
| Alabama | 2009 | 14 | 0 | 0 |
| Alabama | 2010 | 10 | 3 | 0 |
| Alabama | 2011 | 12 | 1 | 0 |
| Alabama | 2012 | 13 | 1 | 0 |
| Alabama | 2013 | 11 | 2 | 0 |
| Alabama | 2014 | 12 | 2 | 0 |
| Alabama | 2015 | 14 | 1 | 0 |
| Alabama | 2016 | 14 | 1 | 0 |
| Auburn | 1995 | 8 | 4 | 0 |
| Auburn | 1996 | 8 | 4 | 0 |
| Auburn | 1997 | 10 | 3 | 0 |
| Auburn | 1998 | 3 | 8 | 0 |
| Auburn | 1999 | 5 | 6 | 0 |
| Auburn | 2000 | 9 | 4 | 0 |
| Auburn | 2001 | 7 | 5 | 0 |
| Auburn | 2002 | 9 | 4 | 0 |
| Auburn | 2003 | 8 | 5 | 0 |
| Auburn | 2004 | 13 | 0 | 0 |
| Auburn | 2005 | 9 | 3 | 0 |
| Auburn | 2006 | 11 | 2 | 0 |
| Auburn | 2007 | 9 | 4 | 0 |
| Auburn | 2008 | 5 | 7 | 0 |
| Auburn | 2009 | 8 | 5 | 0 |
| Auburn | 2010 | 14 | 0 | 0 |
| Auburn | 2011 | 8 | 5 | 0 |
| Auburn | 2012 | 3 | 9 | 0 |
| Auburn | 2013 | 12 | 2 | 0 |
| Auburn | 2014 | 8 | 5 | 0 |
| Auburn | 2015 | 7 | 6 | 0 |
| Auburn | 2016 | 8 | 5 | 0 |
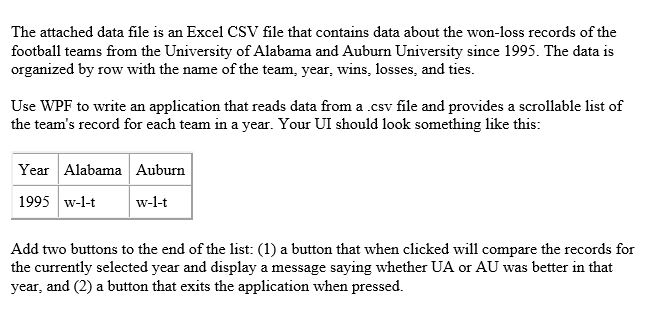
The attached data file is an Excel CSV file that contains data about the won-loss records of the football teams from the University of Alabama and Auburn University since 1995. The data i!s organized by row with the name of the team, year, wins, losses, and ties Use WPF to write an application that reads data from a .csv file and provides a scrollable list of the team's record for each team in a year. Your UI should look something like this: Year Alabama Auburn 1995 w-1-t w-1-t Add two buttons to the end of the list: (1) a button that when clicked will compare the records for the currently selected year and display a message saying whether UA or AU was better in that year, and (2) a button that exits the application when pressed
Step by Step Solution
There are 3 Steps involved in it
Step: 1

Get Instant Access to Expert-Tailored Solutions
See step-by-step solutions with expert insights and AI powered tools for academic success
Step: 2

Step: 3

Ace Your Homework with AI
Get the answers you need in no time with our AI-driven, step-by-step assistance
Get Started


