

Answered step by step
Verified Expert Solution
Question
1 Approved Answer
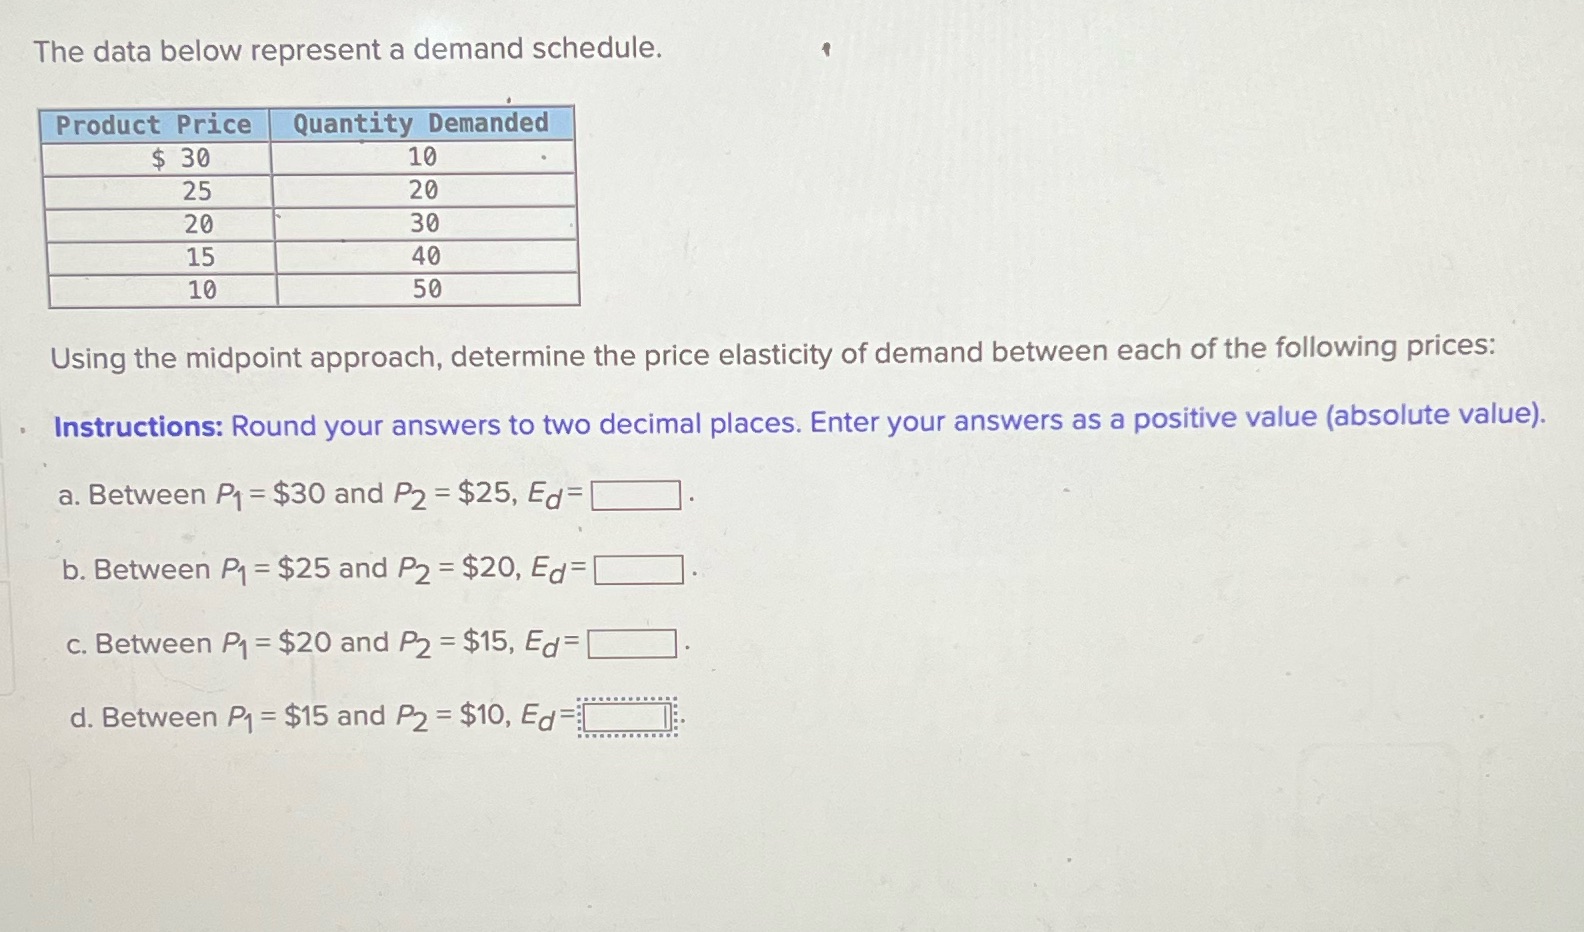
The data below represent a demand schedule. Product Price Quantity Demanded $ 30 10 25 20 20 30 15 40 10 50 Using the midpoint
Step by Step Solution
There are 3 Steps involved in it
Step: 1

Get Instant Access to Expert-Tailored Solutions
See step-by-step solutions with expert insights and AI powered tools for academic success
Step: 2

Step: 3
Ace Your Homework with AI
Get the answers you need in no time with our AI-driven, step-by-step assistance
Get Started
Human Resources In The Urban Economy
Authors: Mark Perlman
1st Edition
1317332474, 9781317332473