Question
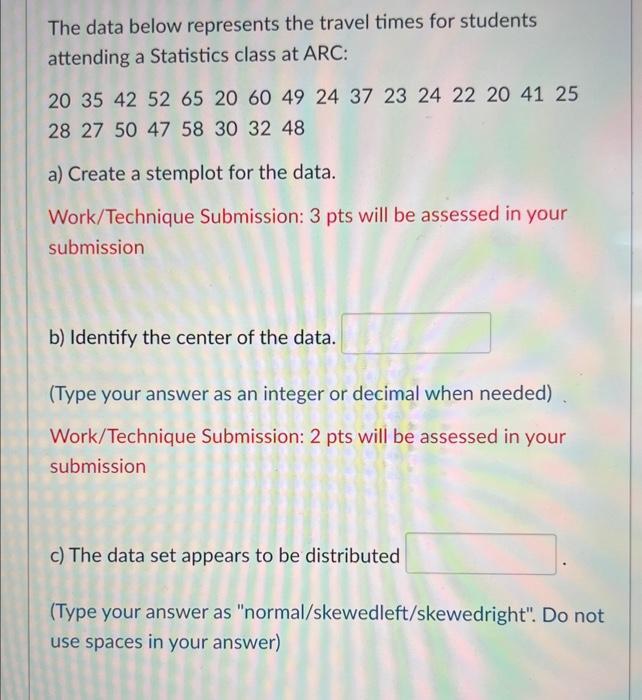
The data below represents the travel times for students attending a Statistics class at ARC: 20 35 42 52 65 20 60 49 24

The data below represents the travel times for students attending a Statistics class at ARC: 20 35 42 52 65 20 60 49 24 37 23 24 22 20 41 25 28 27 50 47 58 30 32 48 a) Create a stemplot for the data. Work/Technique Submission: 3 pts will be assessed in your submission b) Identify the center of the data. (Type your answer as an integer or decimal when needed) Work/Technique Submission: 2 pts will be assessed in your submission c) The data set appears to be distributed (Type your answer as "normal/skewedleft/skewedright". Do not use spaces in your answer)
Step by Step Solution
3.48 Rating (164 Votes )
There are 3 Steps involved in it
Step: 1
Stem plot 1 Sort data set smallest to largest values 2 Stem is on the left side and leaf is on ...
Get Instant Access to Expert-Tailored Solutions
See step-by-step solutions with expert insights and AI powered tools for academic success
Step: 2

Step: 3

Ace Your Homework with AI
Get the answers you need in no time with our AI-driven, step-by-step assistance
Get StartedRecommended Textbook for
Statistics
Authors: Robert S. Witte, John S. Witte
11th Edition
1119254515, 978-1119254515
Students also viewed these Accounting questions
Question
Answered: 1 week ago
Question
Answered: 1 week ago
Question
Answered: 1 week ago
Question
Answered: 1 week ago
Question
Answered: 1 week ago
Question
Answered: 1 week ago
Question
Answered: 1 week ago
Question
Answered: 1 week ago
Question
Answered: 1 week ago
Question
Answered: 1 week ago
Question
Answered: 1 week ago
Question
Answered: 1 week ago
Question
Answered: 1 week ago
Question
Answered: 1 week ago
Question
Answered: 1 week ago
Question
Answered: 1 week ago
Question
Answered: 1 week ago
Question
Answered: 1 week ago
Question
Answered: 1 week ago
Question
Answered: 1 week ago
Question
Answered: 1 week ago
Question
Answered: 1 week ago
Question
Answered: 1 week ago
Question
Answered: 1 week ago
View Answer in SolutionInn App


