Question
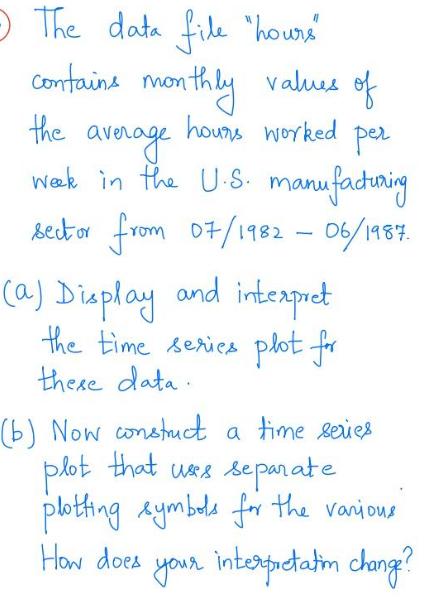
- The data file hours contains monthly values of the average hours worked per week in the U.S. manufacturing sector from 07/1982 - 06/1987.

- The data file "hours" contains monthly values of the average hours worked per week in the U.S. manufacturing sector from 07/1982 - 06/1987. (a) Display and interpret the time series plot for these data. (b) Now construct a time series. plot that uses separate plotting symbols for the various" How does your interpretation change?
Step by Step Solution
3.34 Rating (157 Votes )
There are 3 Steps involved in it
Step: 1
Exercises 34 The data file hours contains monthly values of the average hours worked per ...
Get Instant Access to Expert-Tailored Solutions
See step-by-step solutions with expert insights and AI powered tools for academic success
Step: 2

Step: 3

Ace Your Homework with AI
Get the answers you need in no time with our AI-driven, step-by-step assistance
Get StartedRecommended Textbook for
Statistics For Business Decision Making And Analysis
Authors: Robert Stine, Dean Foster
2nd Edition
978-0321836519, 321836510, 978-0321890269
Students also viewed these Accounting questions
Question
Answered: 1 week ago
Question
Answered: 1 week ago
Question
Answered: 1 week ago
Question
Answered: 1 week ago
Question
Answered: 1 week ago
Question
Answered: 1 week ago
Question
Answered: 1 week ago
Question
Answered: 1 week ago
Question
Answered: 1 week ago
Question
Answered: 1 week ago
Question
Answered: 1 week ago
Question
Answered: 1 week ago
Question
Answered: 1 week ago
Question
Answered: 1 week ago
Question
Answered: 1 week ago
Question
Answered: 1 week ago
Question
Answered: 1 week ago
Question
Answered: 1 week ago
Question
Answered: 1 week ago
Question
Answered: 1 week ago
Question
Answered: 1 week ago
View Answer in SolutionInn App


