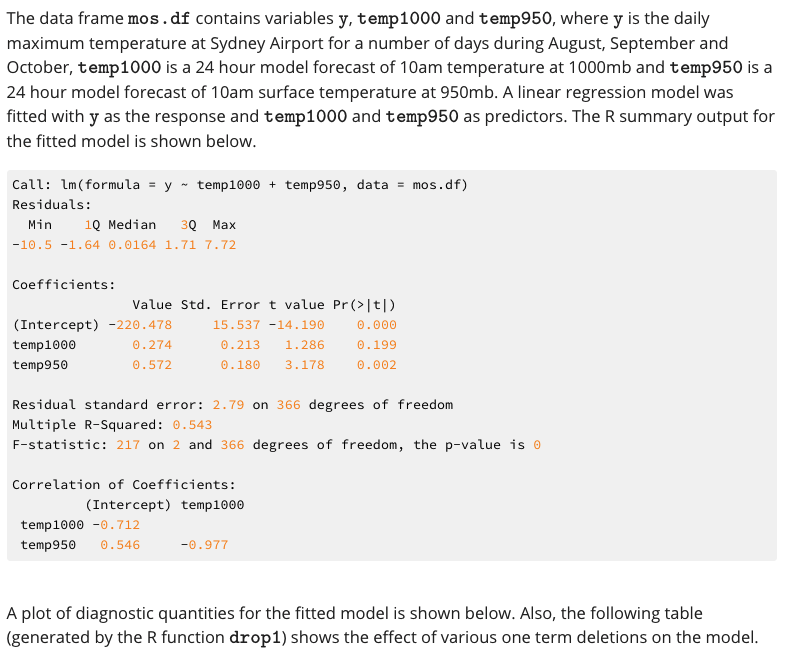
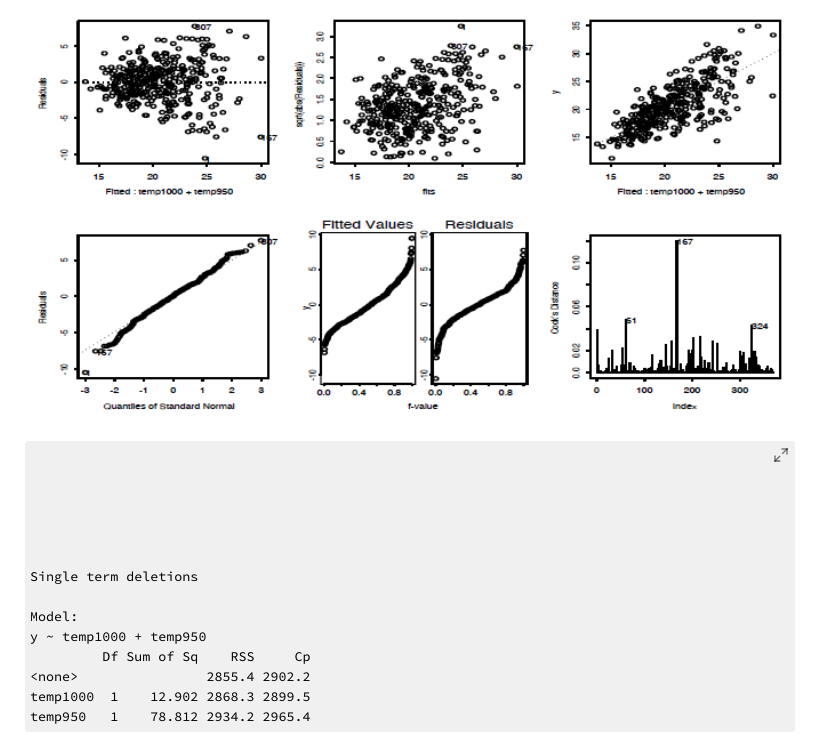
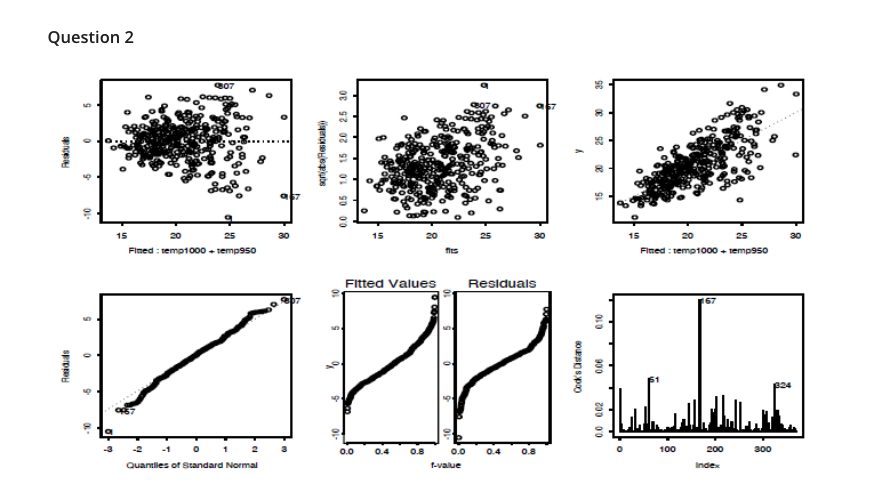
The data frame mos.df contains variables y, temp1000 and temp950, where y is the daily maximum temperature at Sydney Airport for a number of days during August, September and October, temp1000 is a 24 hour model forecast of 10am temperature at 1000mb and temp950 is a 24 hour model forecast of 10am surface temperature at 950mb. A linear regression model was fitted with y as the response and temp1000 and temp950 as predictors. The R summary output for the fitted model is shown below. Call: Im(formula = y - temp1000 + temp950, data = mos.df) Residuals: Min 1Q Median 3Q Max -10.5 -1.64 0.0164 1.71 7.72 Coefficients: Value Std. Error t value Pr(>1t| (Intercept) -220.478 15.537 -14.190 0.000 temp1000 0.274 0.213 1.286 0.199 temp950 0.572 0.180 3.178 0.002 Residual standard error: 2.79 on 366 degrees of freedom Multiple R-Squared: 0.543 F-statistic: 217 on 2 and 366 degrees of freedom, the p-value is o Correlation of Coefficients: (Intercept) temp 1000 temp 1000 -0.712 temp950 0.546 -0.977 A plot of diagnostic quantities for the fitted model is shown below. Also, the following table (generated by the R function drop1) shows the effect of various one term deletions on the model. 307 57 log 3. SA 25 Posts aritalai 00 05 10 15 20 25 20 20 957 15 q 9 15 20 25 Fined: temo1000 temp950 30 15 20 25 fies Fined: temp 1000 + temp950 Fitted Values Residuals 67 010 Reidas Cock's Distance 006 00 002 OL- 0.0 0.8 0.4 100 300 0.0 P-value 200 Index Quantles of Standard Normal Single term deletions Model: temp1000 + temp950 Df Sum of sa RSS
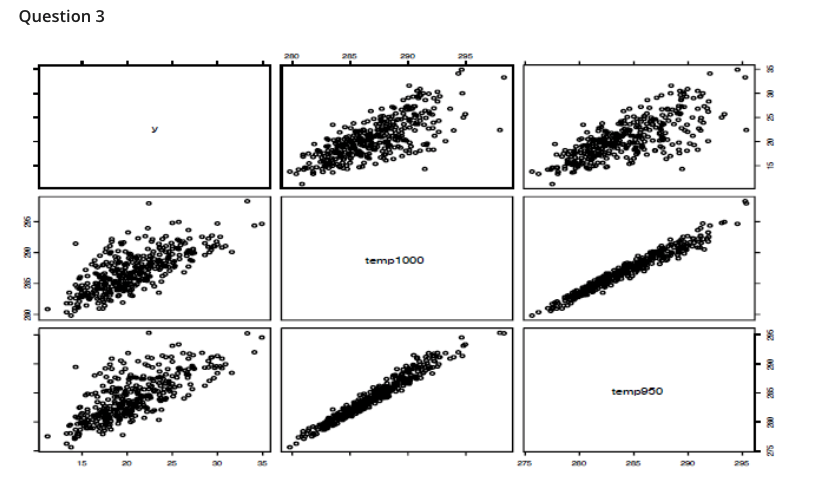
2855.4 2902.2 temp1000 1 12.902 2868.3 2899.5 temp950 1 78.812 2934.2 2965.4 200 290 8 . a 15 9R GO 200 temp 1000 92 tempeso 216 6 ano 25 Finally, the pairs plot (showing pairwise scatterplots for the variables y, x1 and x2) is shown below. Question 1 Please select the correct statements from the following list. Dropping temp 1000 is appropriate based on Cp Dropping temp 1000 is appropriate by partial t-test Dropping temp950 is appropriate by partial t-test Dropping temp950 is appropriate based on Cp The model with both variables is not a good model, by F-test More variables will not increase the residuals Less variables will lead to less bias Less variables will lead to less variability in the prediction Question 2 Se 007 OOOOOO 3 25 Results aritalsturt 00 05 10 15 20 25 20 15 -10 30 15 20 25 15 20 25 Fimed: Temp1000 temp950 15 20 25 Fined: temp 1000 temp950 Fitted Values Residuals 5 010 0 Resides Cock's Distance 900 200 00 w 1 1 0.0 0.0 0.4 0.8 100 300 200 Index Quantlles of Standard Normal P-value Consider the diagnostic plots. Please select the correct statements below. The residuals have equal variance There is no potential outliers The residuals are normally distributed There is deviation from the linearity, violating the assumption of the linear model There's evidence from the plots that the data may not be independent Submit Question 3 200 F 15 temp 1000 tempeso 6 15 20 275 ano 205 290 From the pairs plot above, please select the correct statements below: There's moderate amount of collinearity between the variables There's strong collinearity between the variables When there is collinearity, model parameters estimates can be very large positive When there is collinearity, model parameters estimates can be very large negative Ridge regression cannot help with this problem Submit The data frame mos.df contains variables y, temp1000 and temp950, where y is the daily maximum temperature at Sydney Airport for a number of days during August, September and October, temp1000 is a 24 hour model forecast of 10am temperature at 1000mb and temp950 is a 24 hour model forecast of 10am surface temperature at 950mb. A linear regression model was fitted with y as the response and temp1000 and temp950 as predictors. The R summary output for the fitted model is shown below. Call: Im(formula = y - temp1000 + temp950, data = mos.df) Residuals: Min 1Q Median 3Q Max -10.5 -1.64 0.0164 1.71 7.72 Coefficients: Value Std. Error t value Pr(>1t| (Intercept) -220.478 15.537 -14.190 0.000 temp1000 0.274 0.213 1.286 0.199 temp950 0.572 0.180 3.178 0.002 Residual standard error: 2.79 on 366 degrees of freedom Multiple R-Squared: 0.543 F-statistic: 217 on 2 and 366 degrees of freedom, the p-value is o Correlation of Coefficients: (Intercept) temp 1000 temp 1000 -0.712 temp950 0.546 -0.977 A plot of diagnostic quantities for the fitted model is shown below. Also, the following table (generated by the R function drop1) shows the effect of various one term deletions on the model. 307 57 log 3. SA 25 Posts aritalai 00 05 10 15 20 25 20 20 957 15 q 9 15 20 25 Fined: temo1000 temp950 30 15 20 25 fies Fined: temp 1000 + temp950 Fitted Values Residuals 67 010 Reidas Cock's Distance 006 00 002 OL- 0.0 0.8 0.4 100 300 0.0 P-value 200 Index Quantles of Standard Normal Single term deletions Model: temp1000 + temp950 Df Sum of sa RSS 2855.4 2902.2 temp1000 1 12.902 2868.3 2899.5 temp950 1 78.812 2934.2 2965.4 200 290 8 . a 15 9R GO 200 temp 1000 92 tempeso 216 6 ano 25 Finally, the pairs plot (showing pairwise scatterplots for the variables y, x1 and x2) is shown below. Question 1 Please select the correct statements from the following list. Dropping temp 1000 is appropriate based on Cp Dropping temp 1000 is appropriate by partial t-test Dropping temp950 is appropriate by partial t-test Dropping temp950 is appropriate based on Cp The model with both variables is not a good model, by F-test More variables will not increase the residuals Less variables will lead to less bias Less variables will lead to less variability in the prediction Question 2 Se 007 OOOOOO 3 25 Results aritalsturt 00 05 10 15 20 25 20 15 -10 30 15 20 25 15 20 25 Fimed: Temp1000 temp950 15 20 25 Fined: temp 1000 temp950 Fitted Values Residuals 5 010 0 Resides Cock's Distance 900 200 00 w 1 1 0.0 0.0 0.4 0.8 100 300 200 Index Quantlles of Standard Normal P-value Consider the diagnostic plots. Please select the correct statements below. The residuals have equal variance There is no potential outliers The residuals are normally distributed There is deviation from the linearity, violating the assumption of the linear model There's evidence from the plots that the data may not be independent Submit Question 3 200 F 15 temp 1000 tempeso 6 15 20 275 ano 205 290 From the pairs plot above, please select the correct statements below: There's moderate amount of collinearity between the variables There's strong collinearity between the variables When there is collinearity, model parameters estimates can be very large positive When there is collinearity, model parameters estimates can be very large negative Ridge regression cannot help with this problem Submit