

Answered step by step
Verified Expert Solution
Question
1 Approved Answer
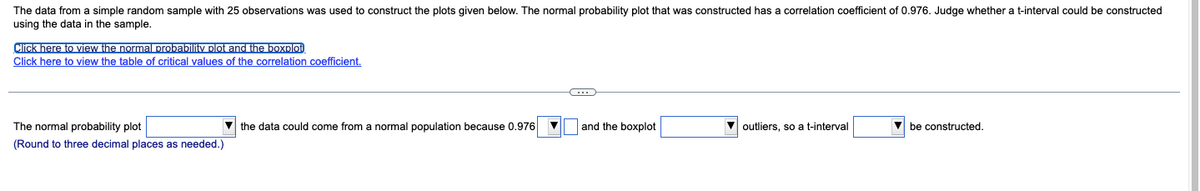
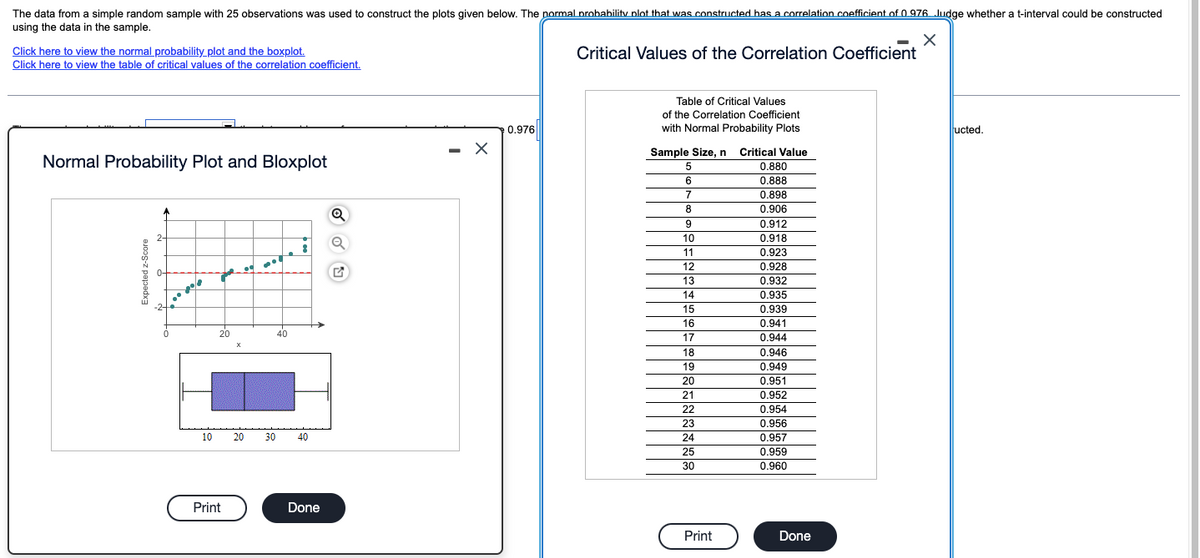
The data from a simple random sample with 25 observations was used to construct the plots given below. The normal probability plot that was constructed
Step by Step Solution
There are 3 Steps involved in it
Step: 1

Get Instant Access to Expert-Tailored Solutions
See step-by-step solutions with expert insights and AI powered tools for academic success
Step: 2

Step: 3
Ace Your Homework with AI
Get the answers you need in no time with our AI-driven, step-by-step assistance
Get Started
The Art Of Proof Basic Training For Deeper Mathematics
Authors: Matthias Beck, Ross Geoghegan
1st Edition
1441970231, 9781441970237